System Overview
What PMTS is, who it serves, and the modules available to county staff.
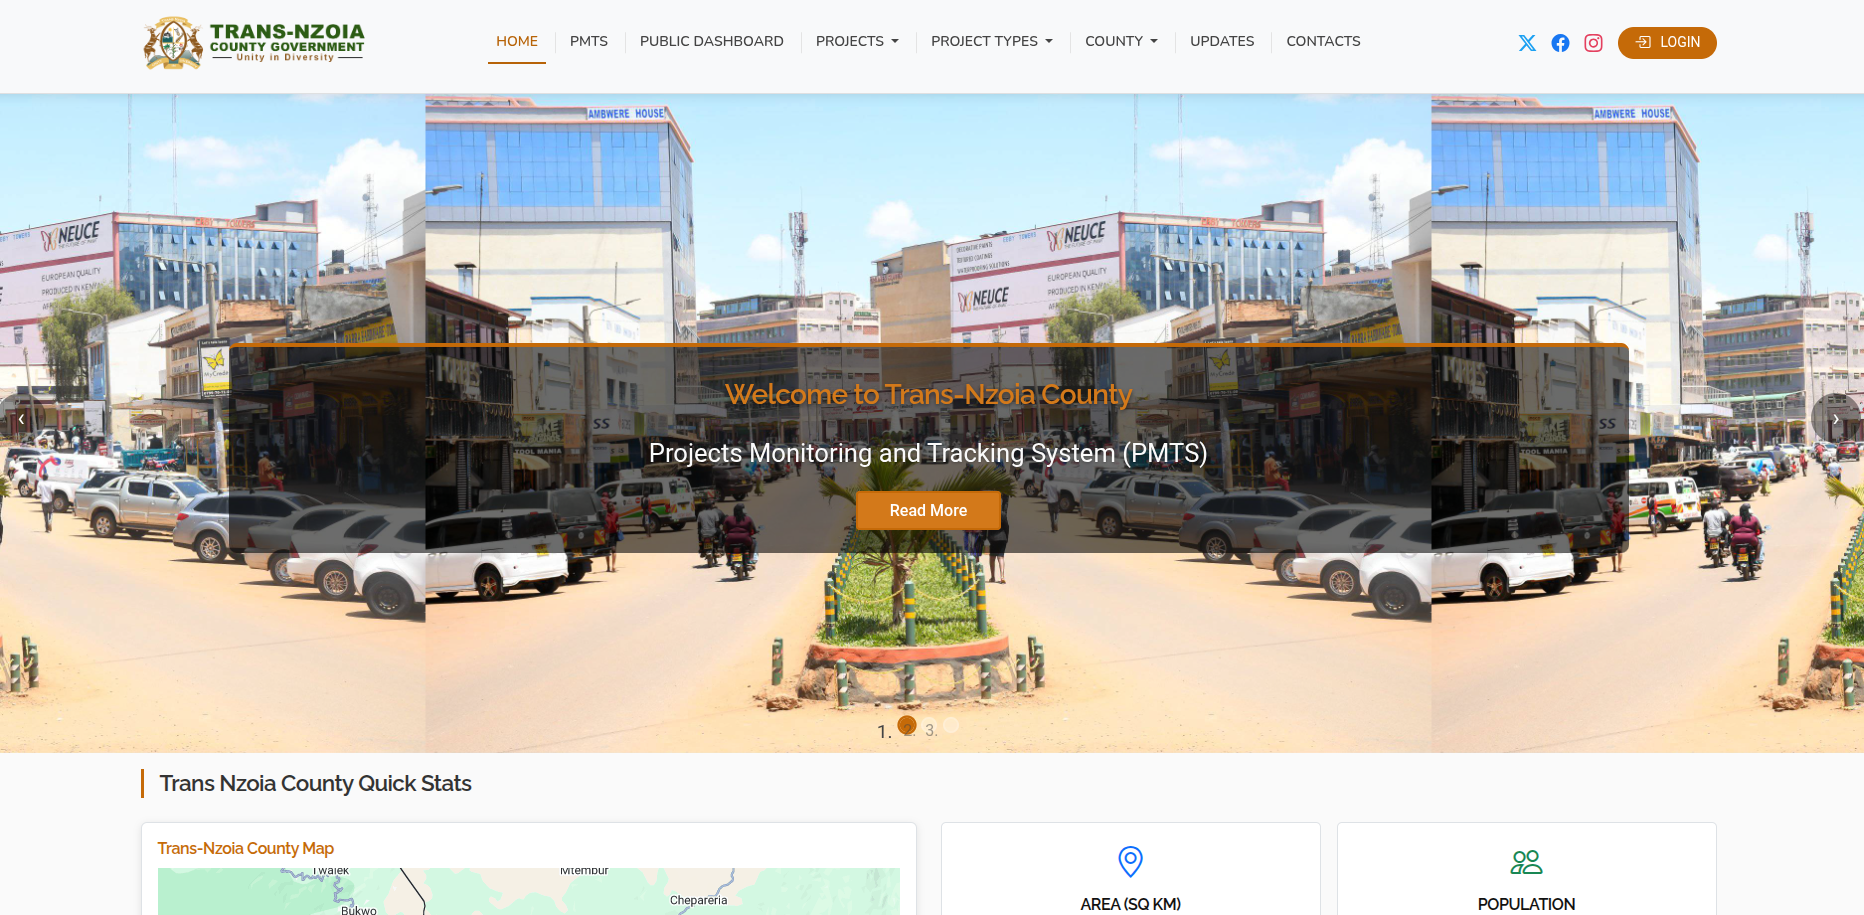
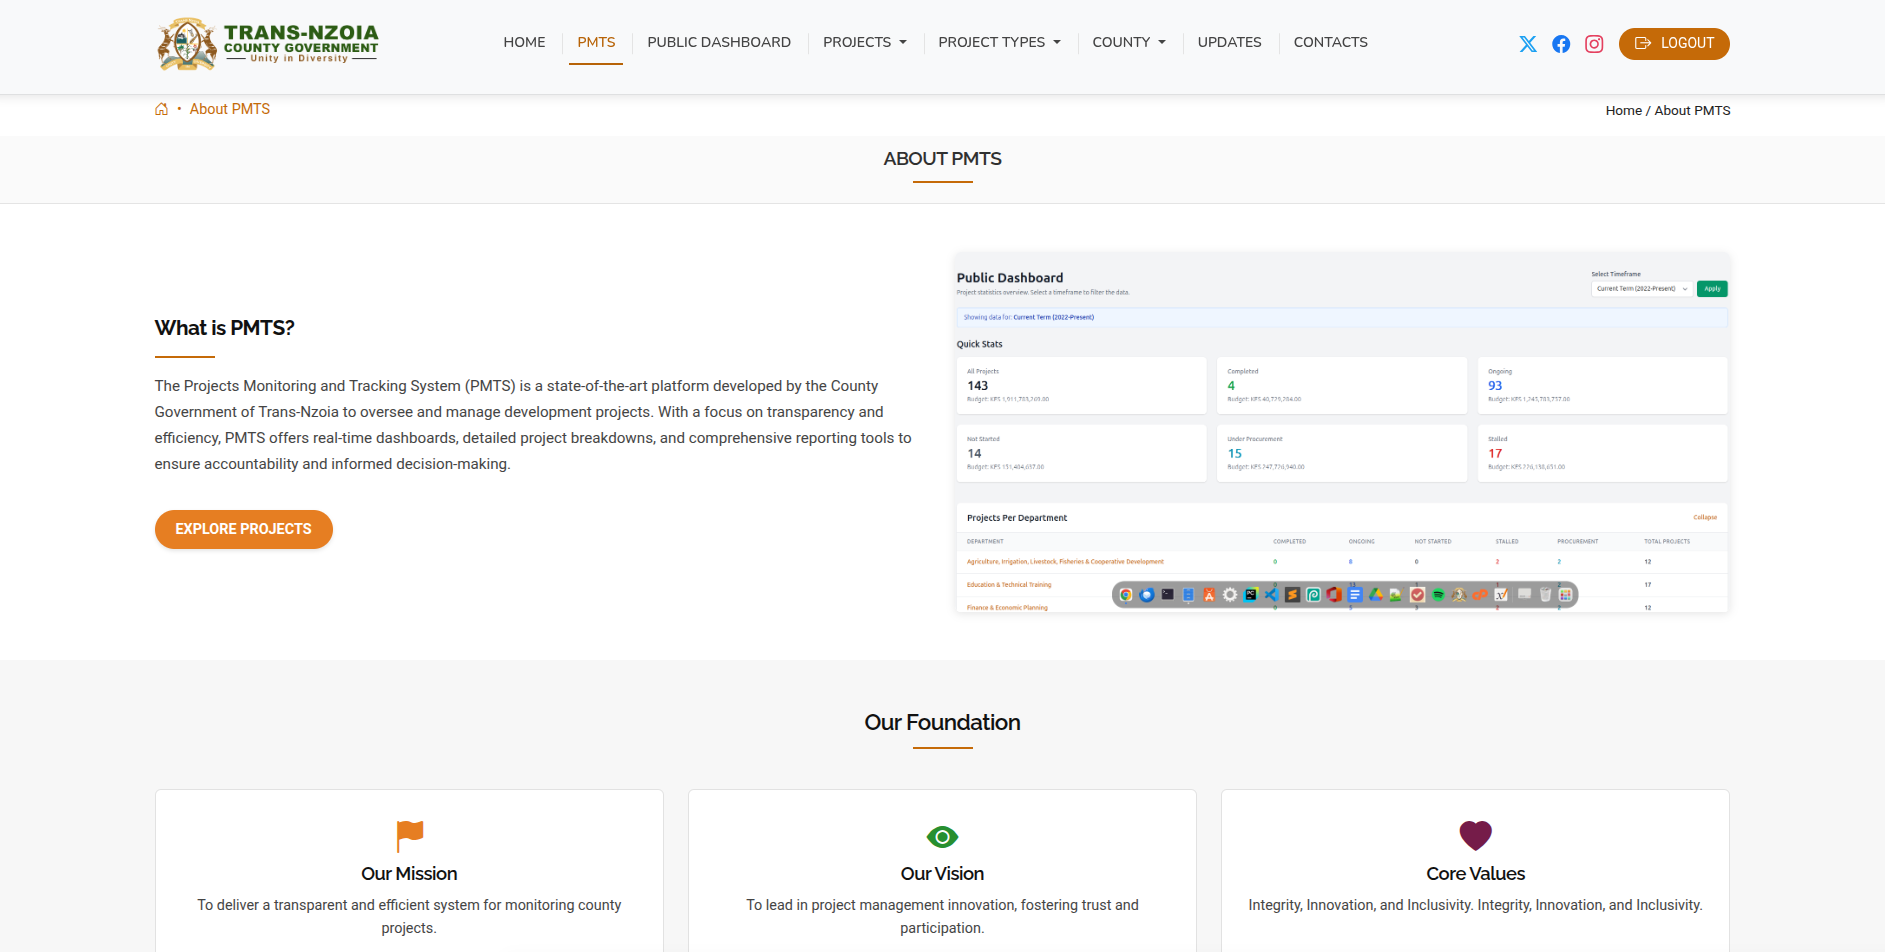
The Projects Monitoring and Tracking System (PMTS) is the county's authoritative platform for registering, tracking, reporting, and publishing development projects. Staff use it to maintain accurate project records; citizens use the public portal to view approved projects and provide feedback.
Key features
| Feature area | What PMTS provides |
|---|---|
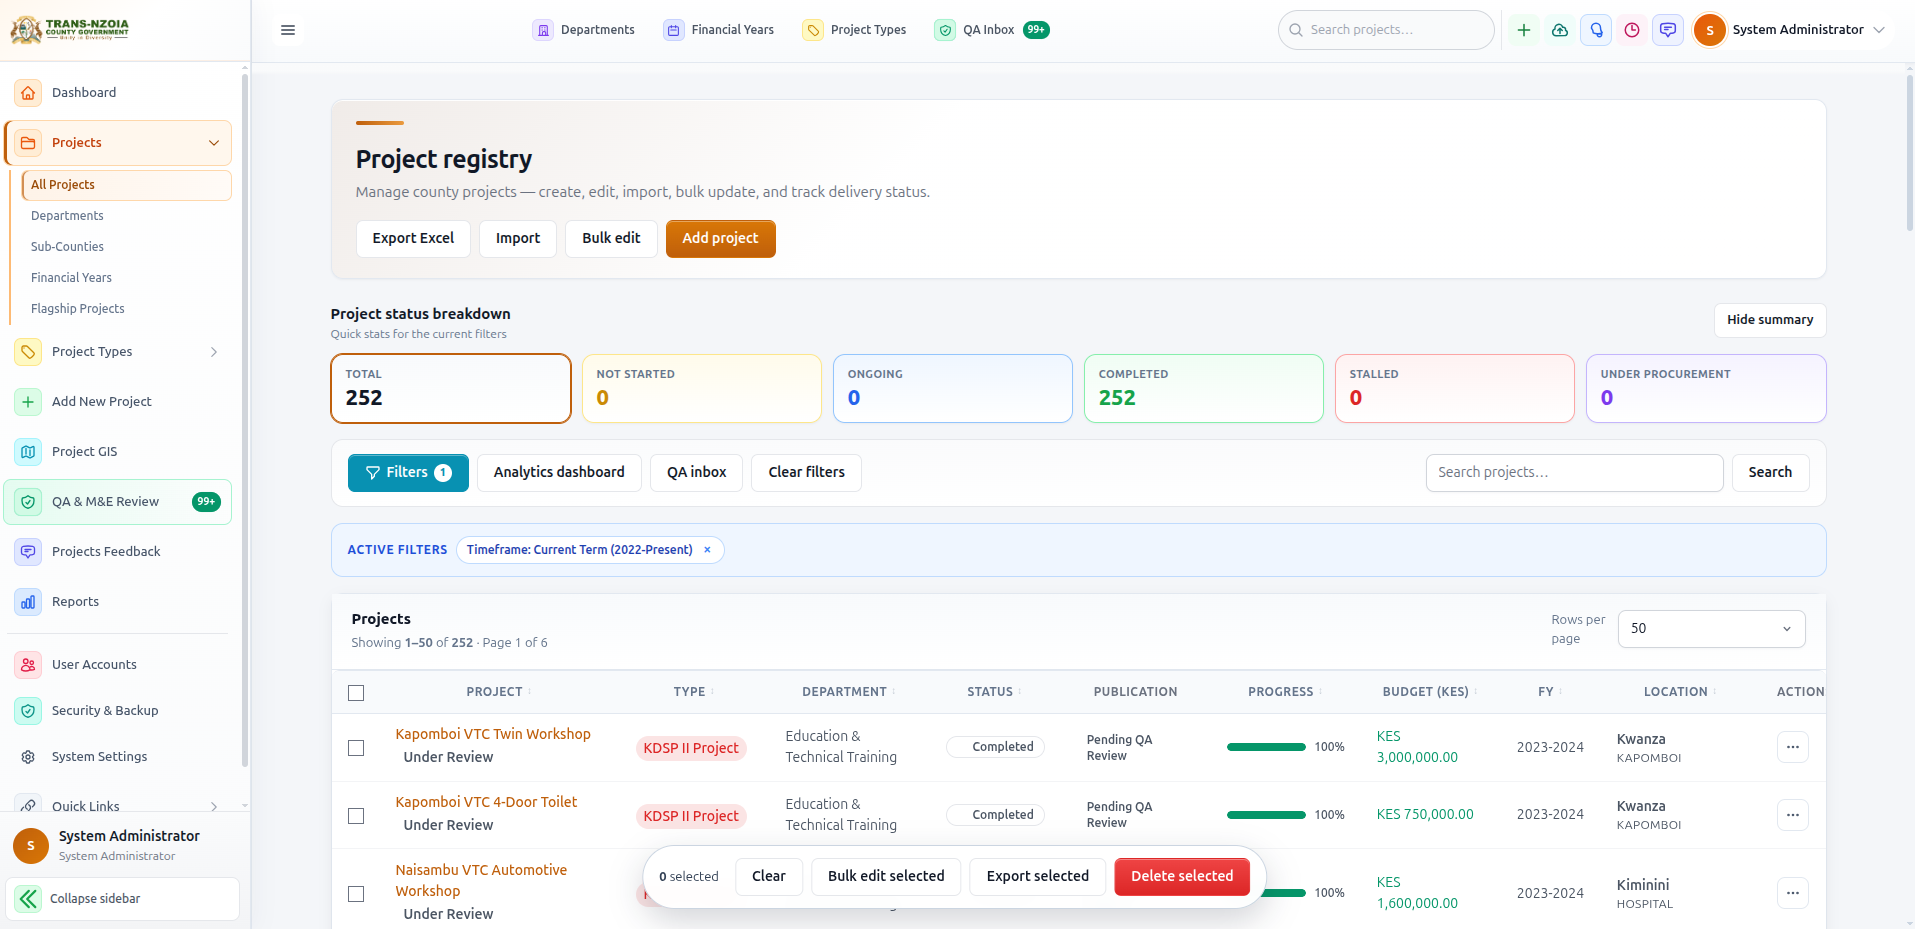
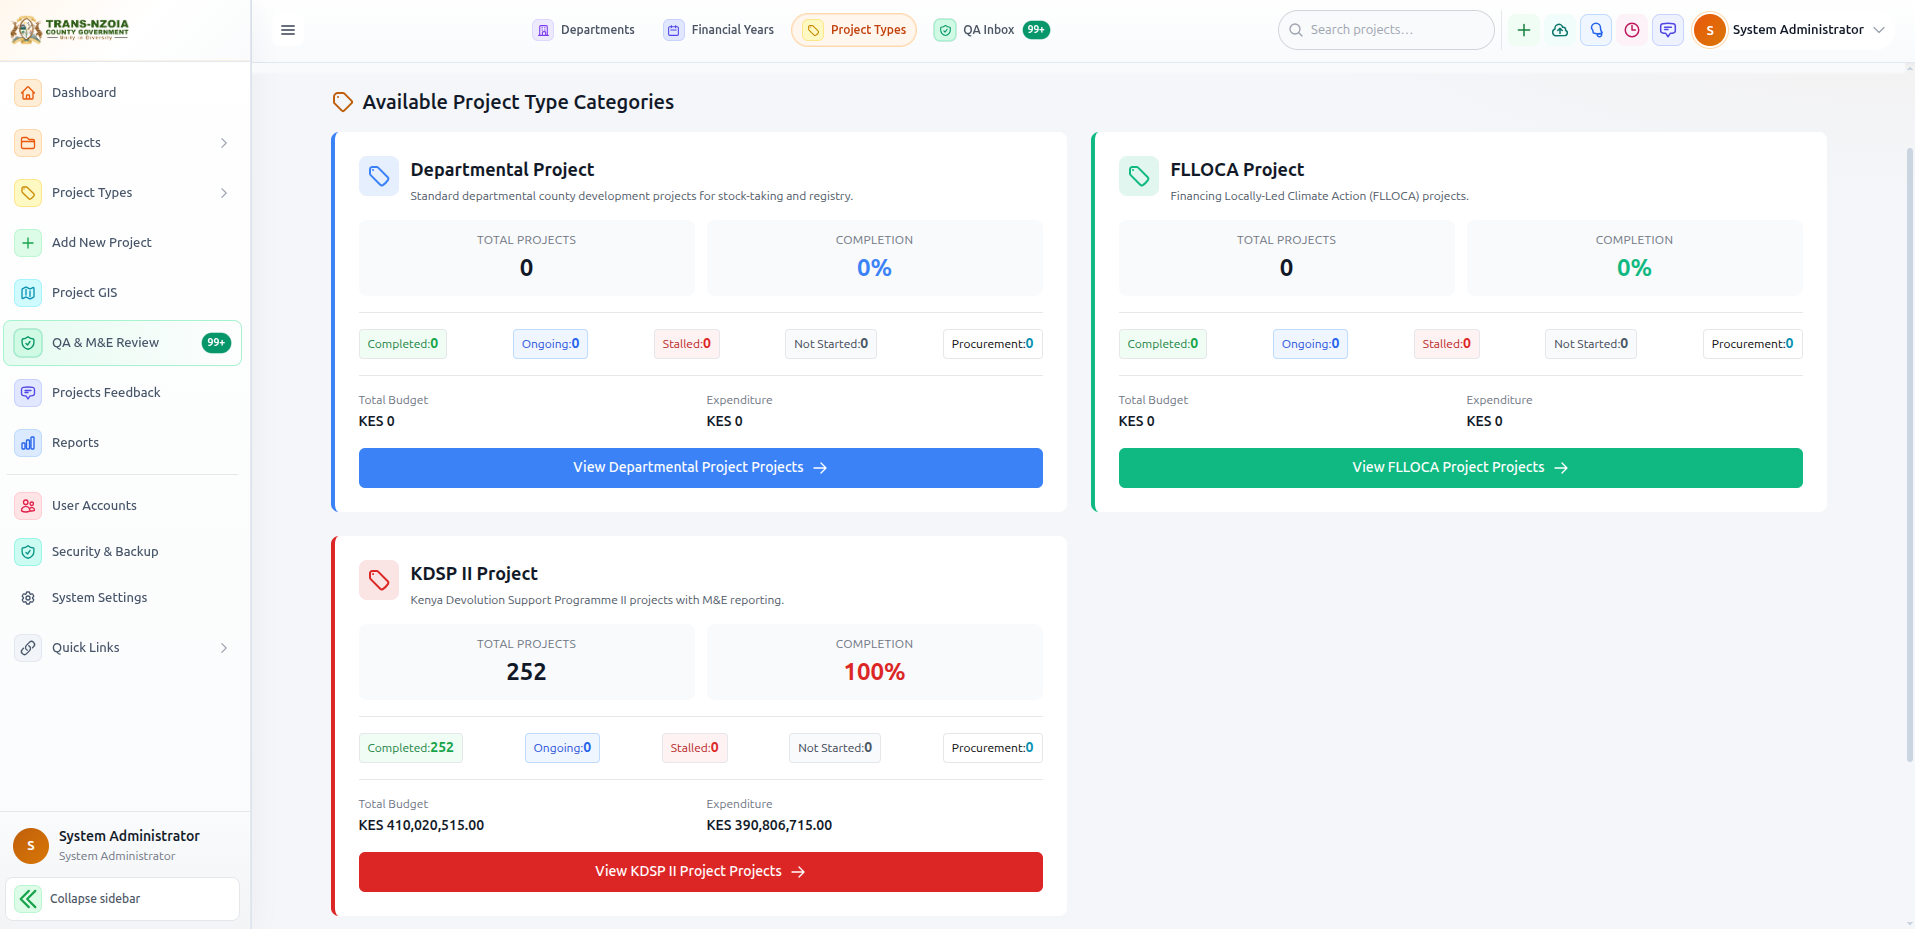
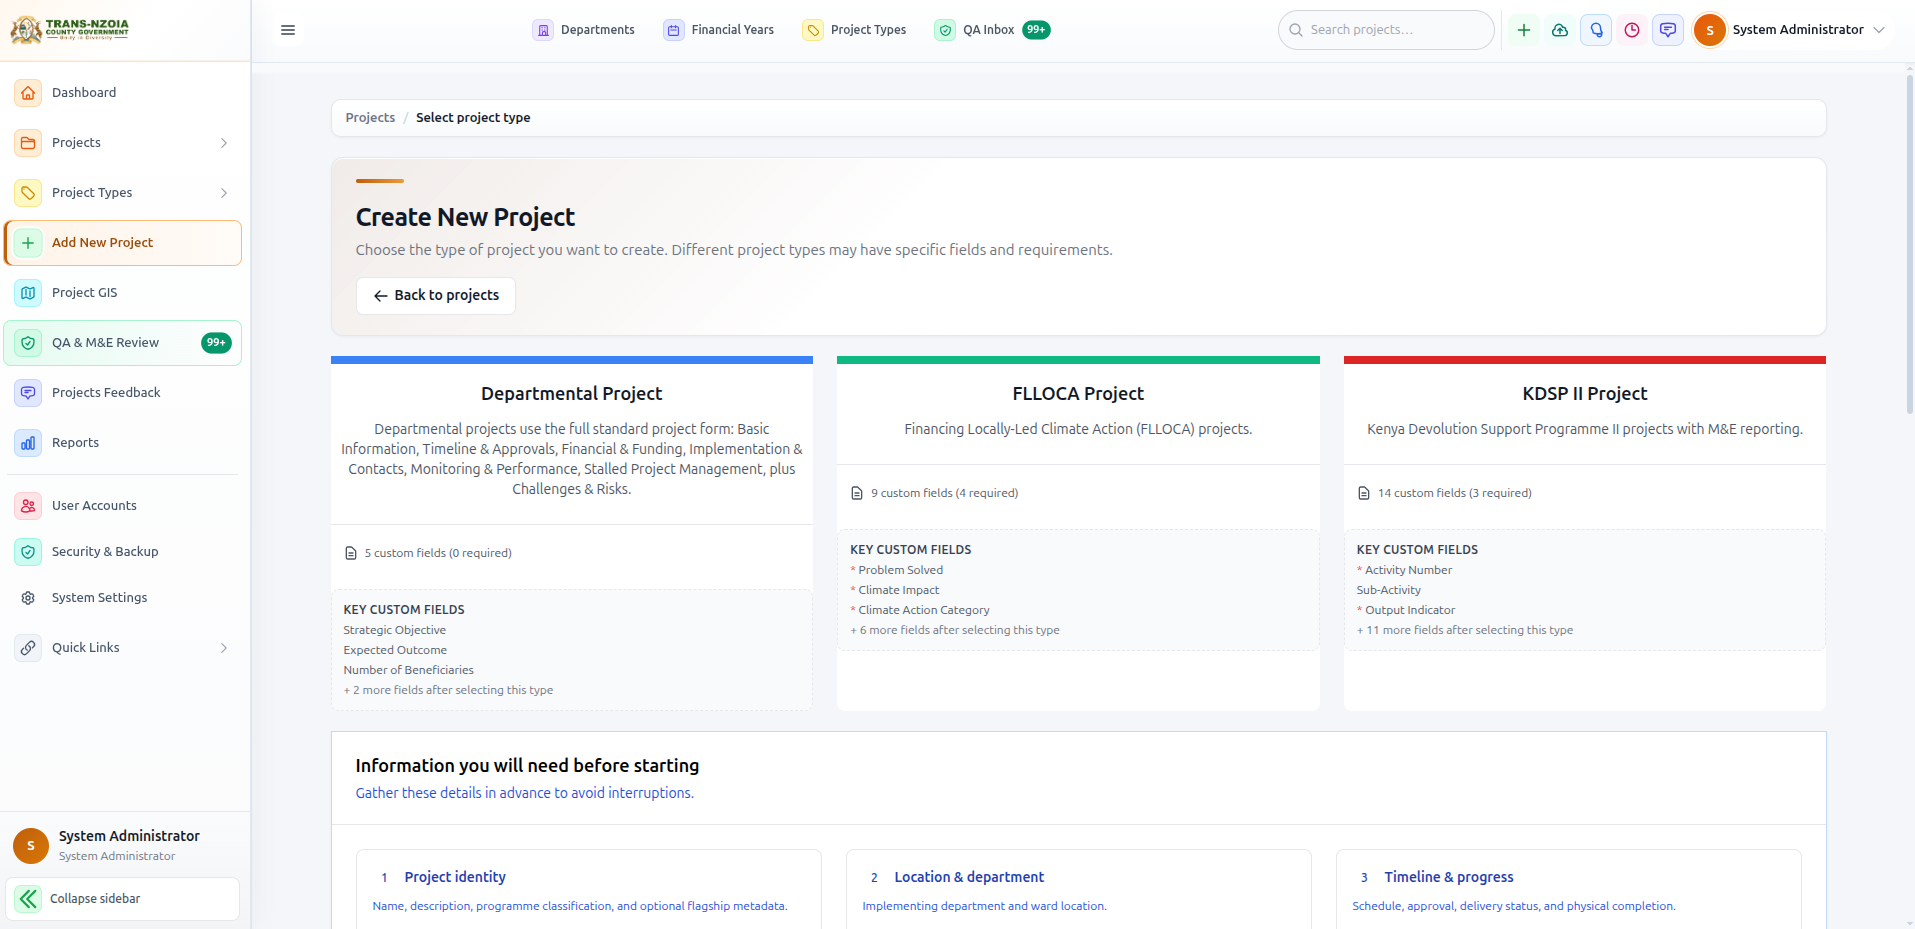
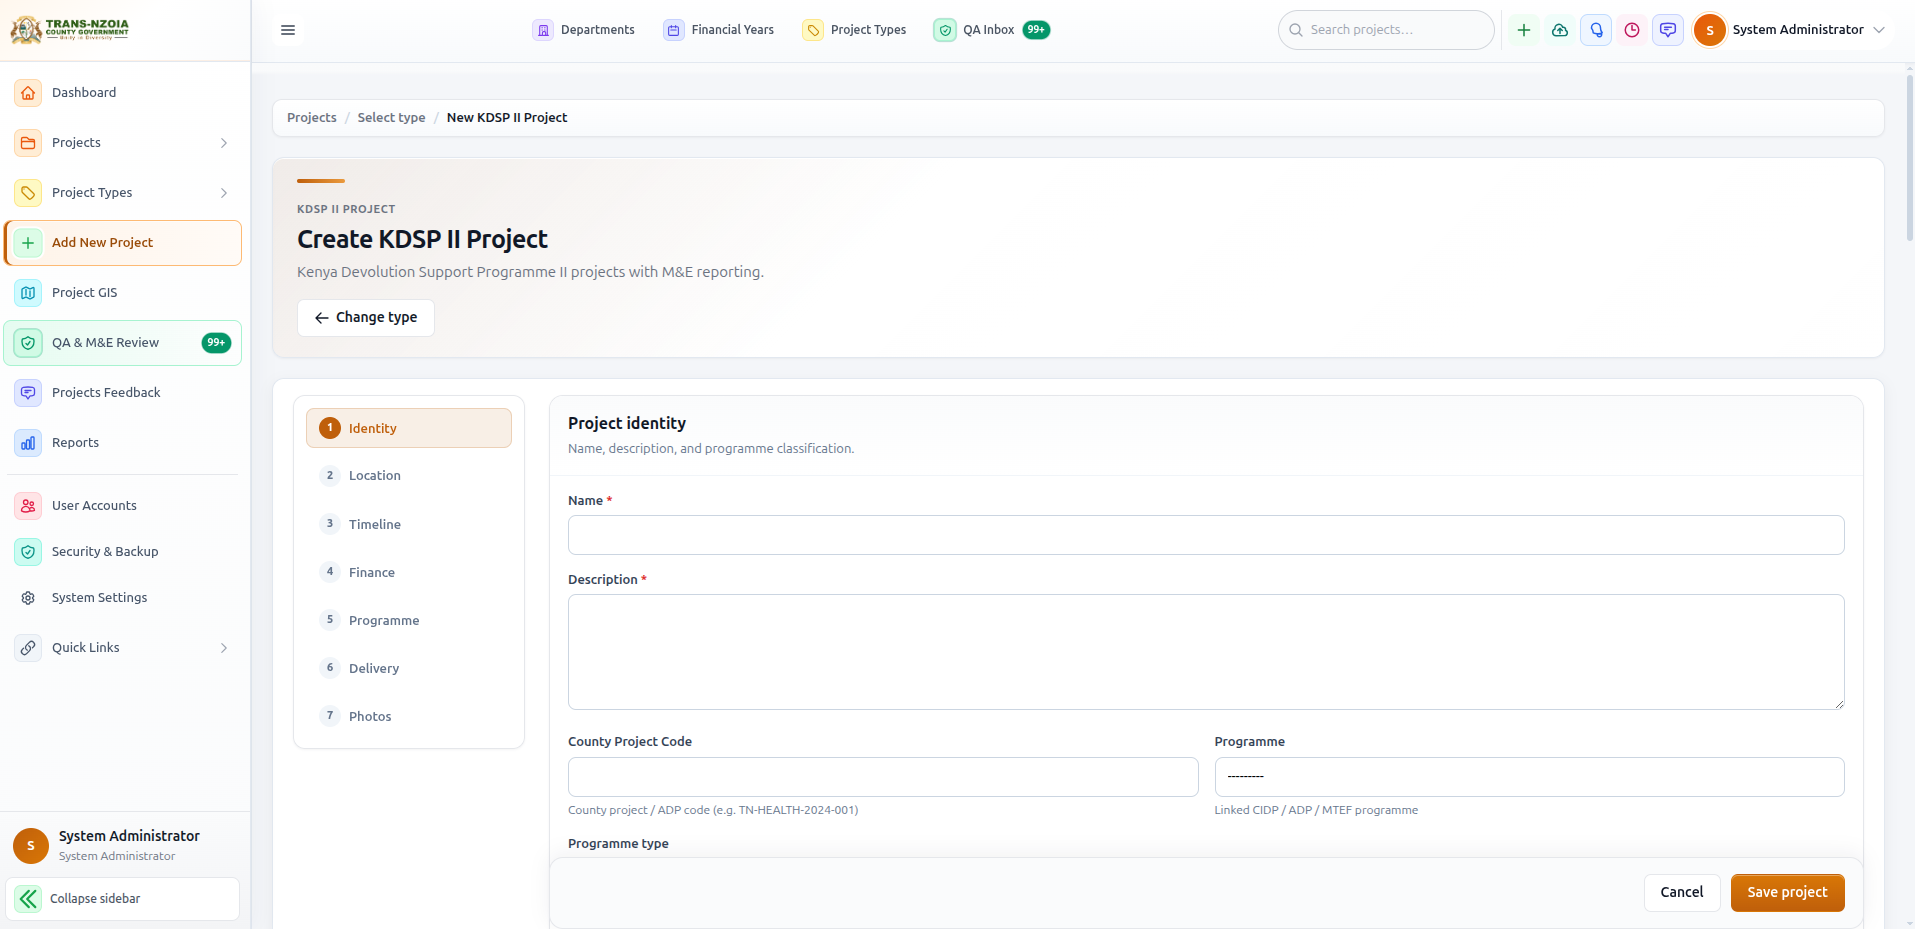
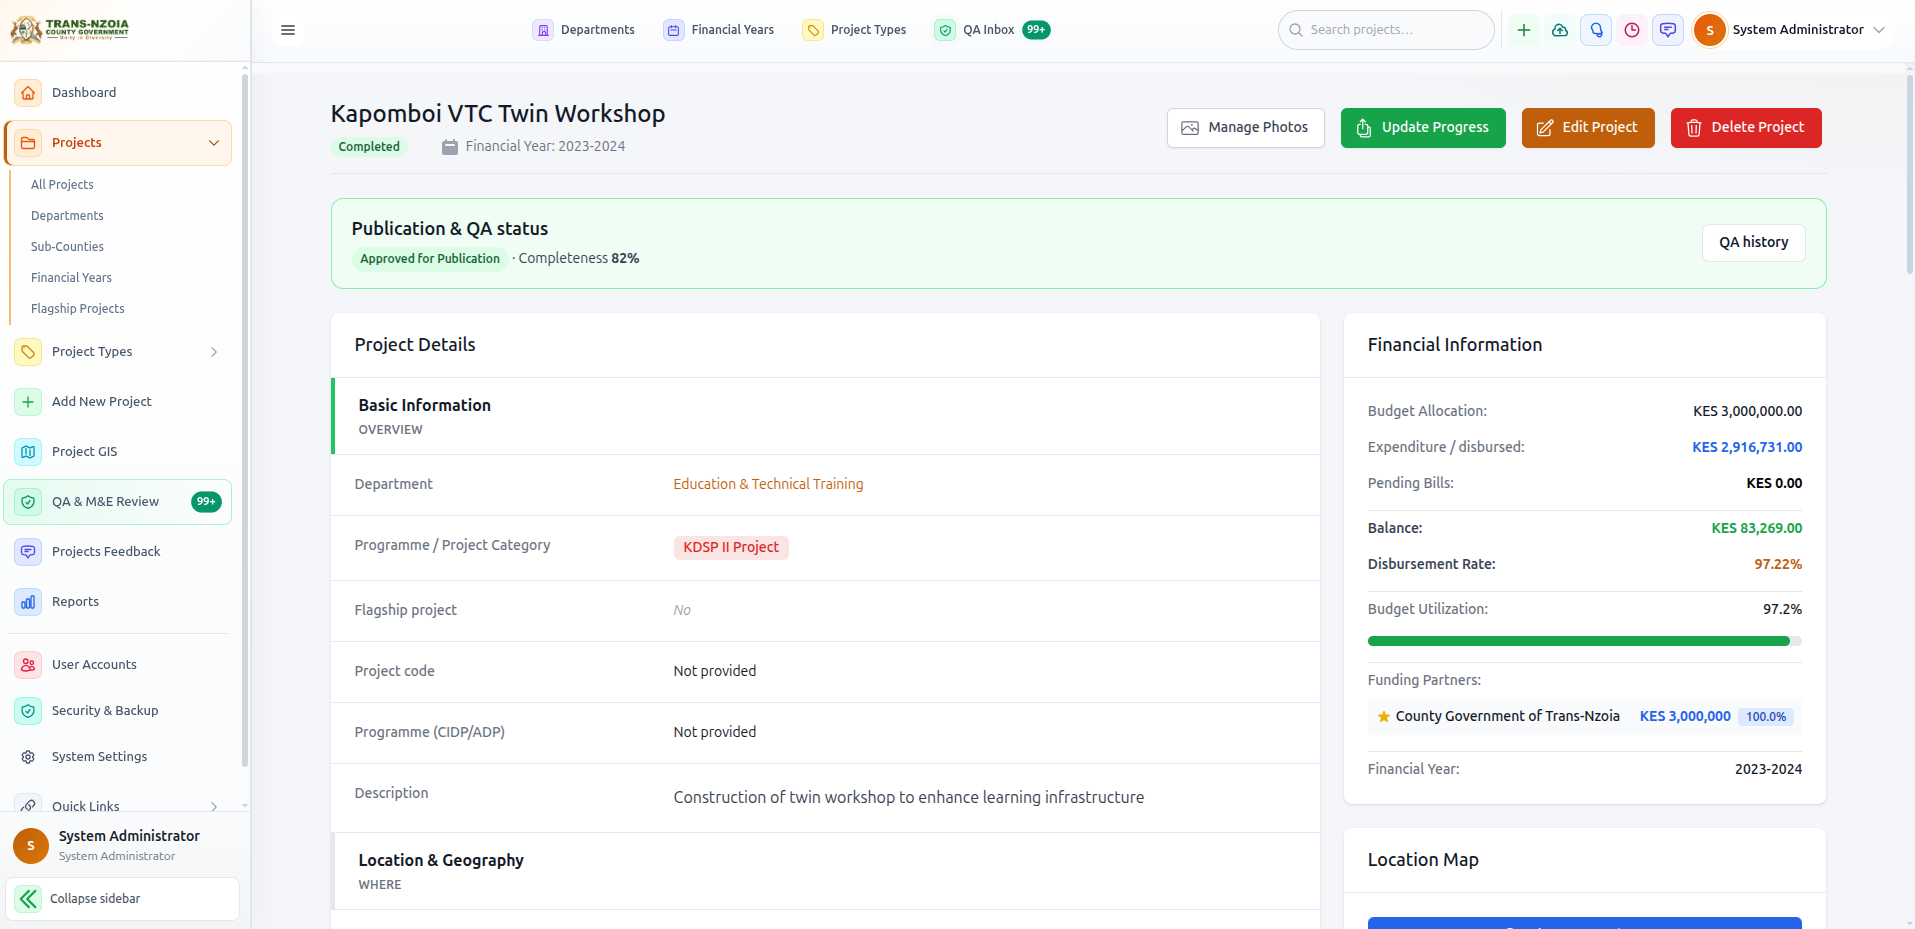
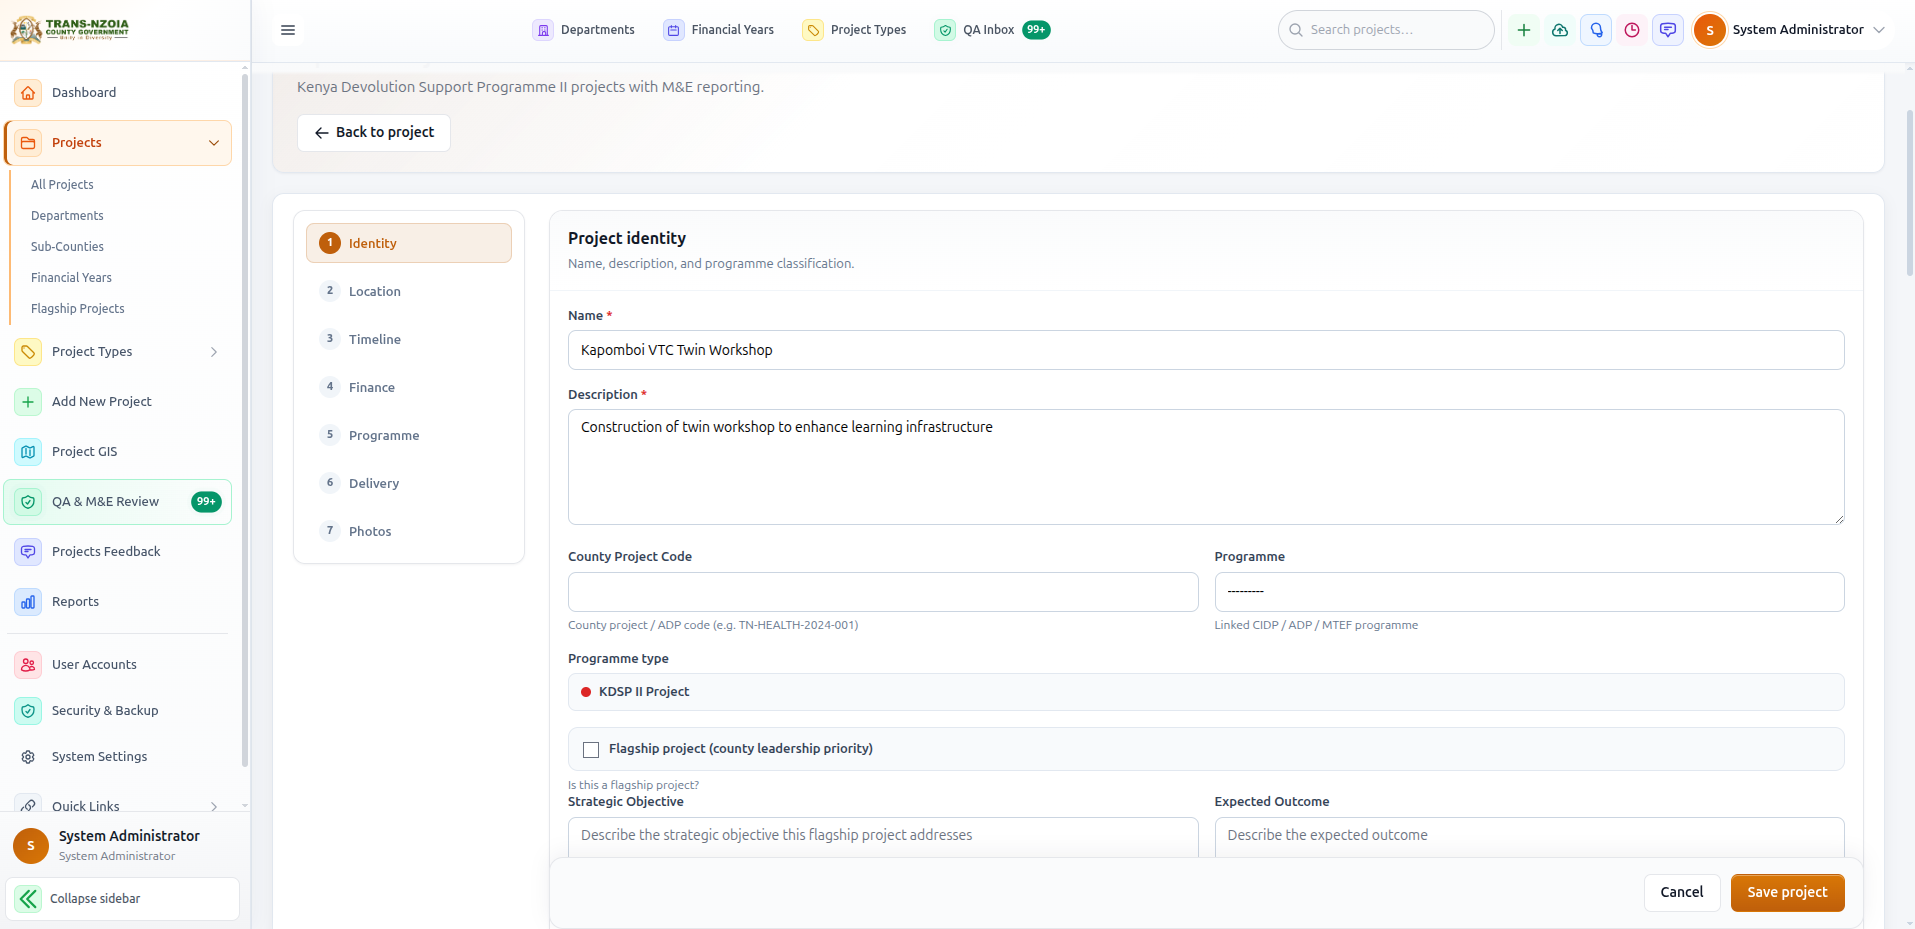
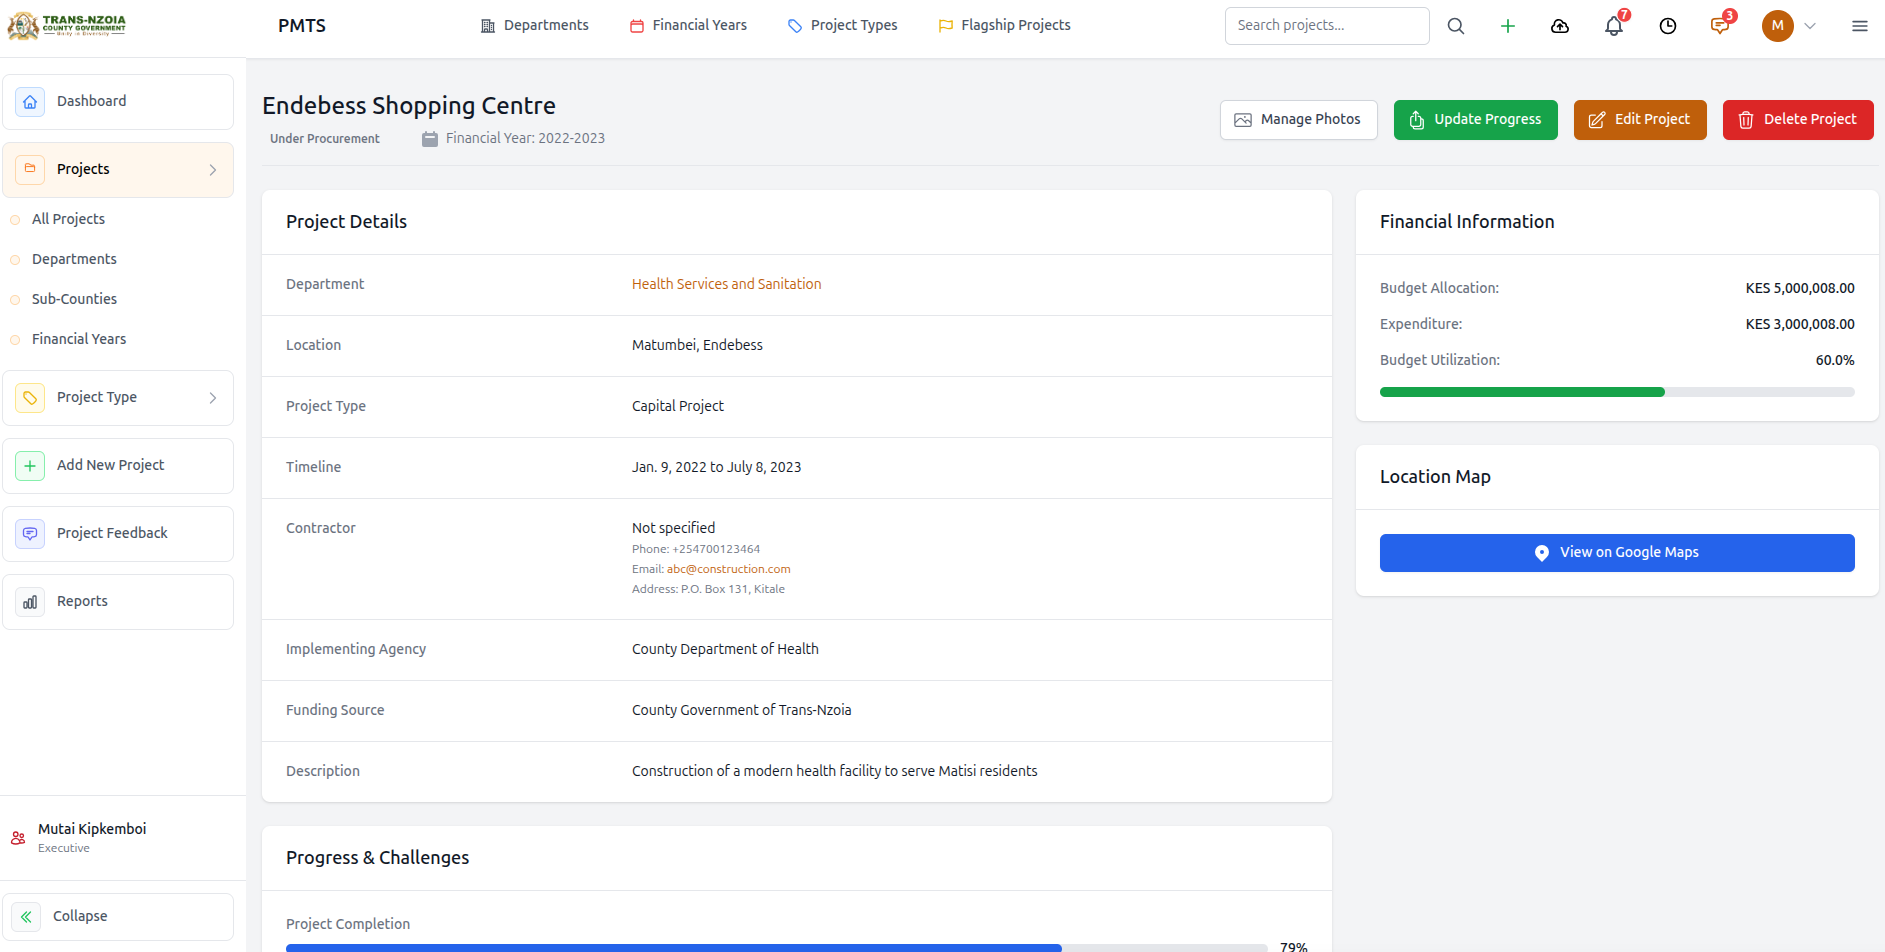
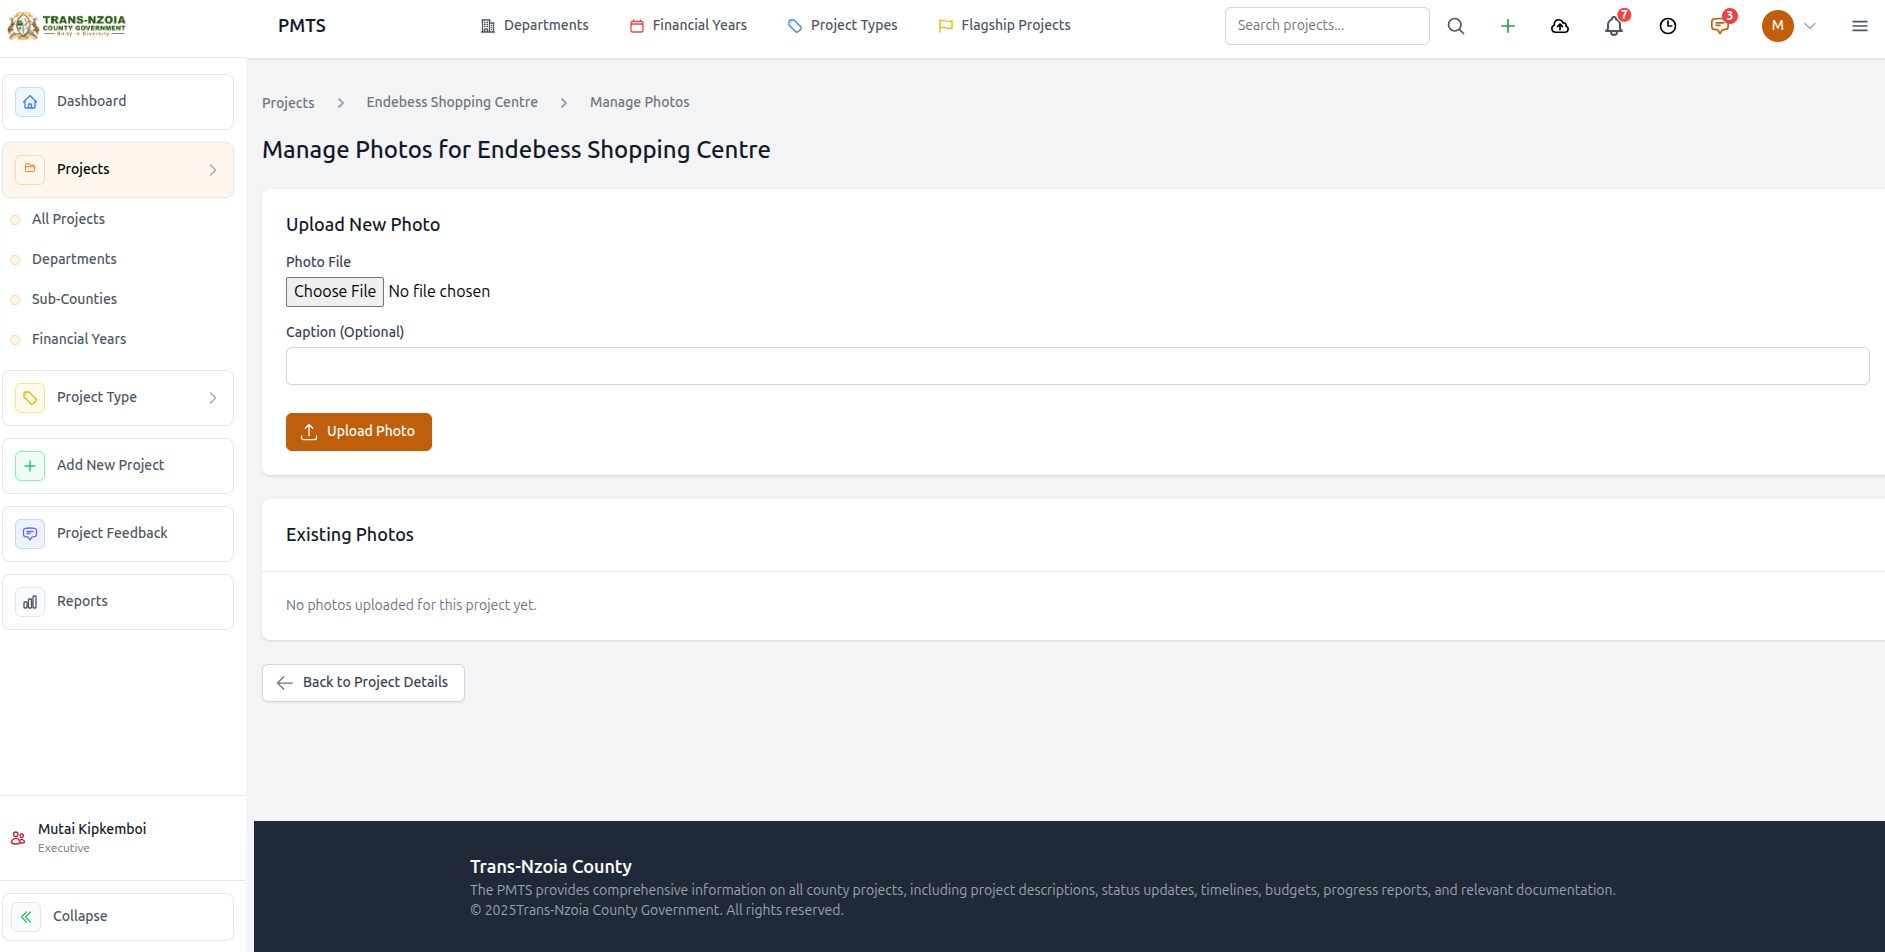
| Project creation & management | Create and edit projects by type; capture budgets, timelines, funding, contractors, locations, and photos. |
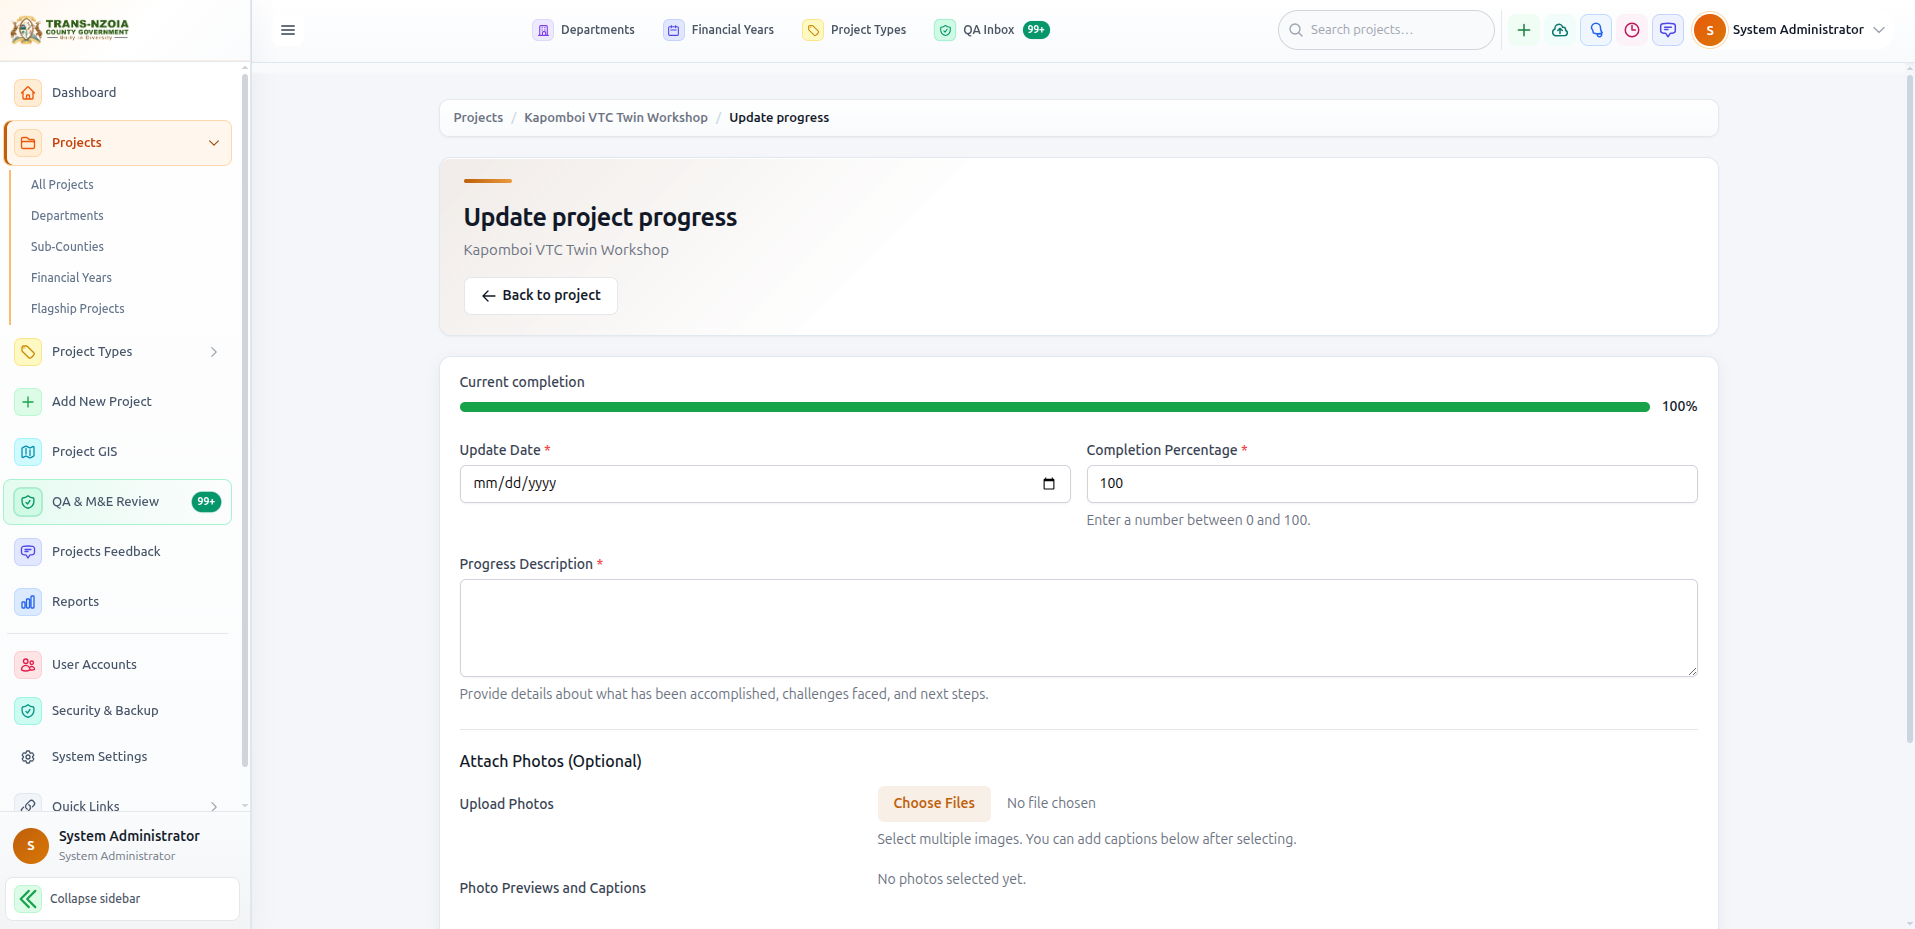
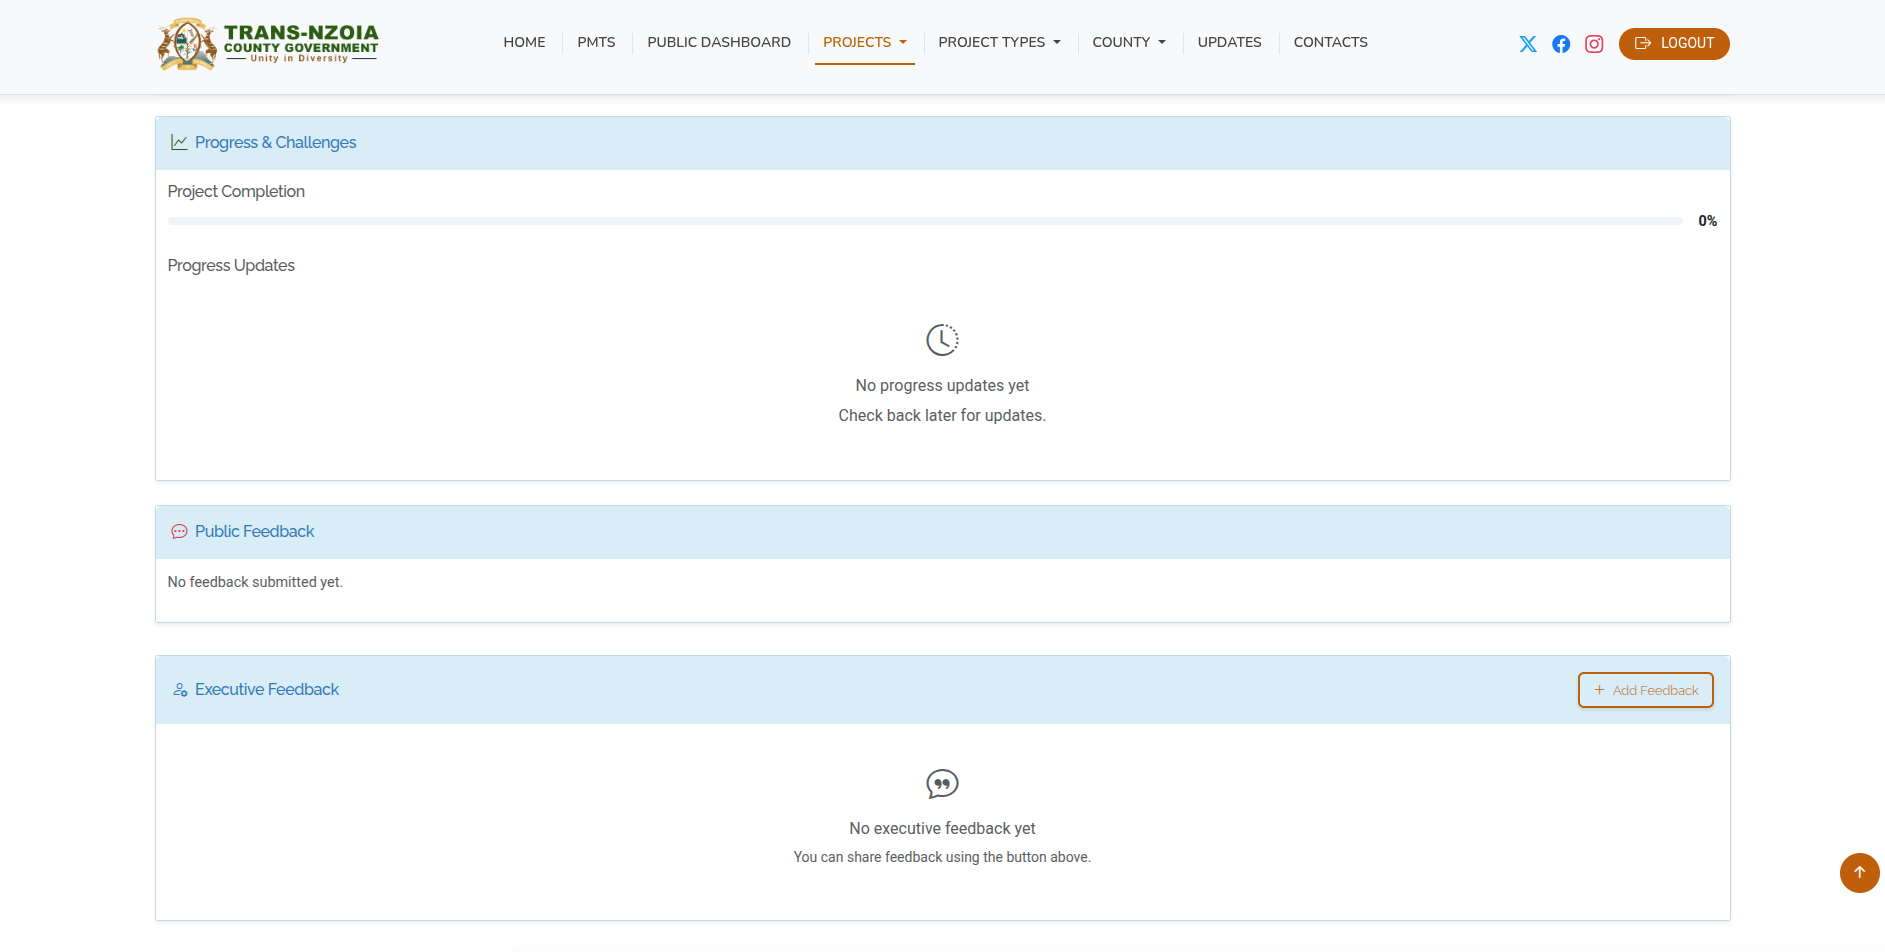
| Project updates & progress tracking | Dated progress entries with percentage complete, narrative descriptions, and optional photos—building a full implementation history. |
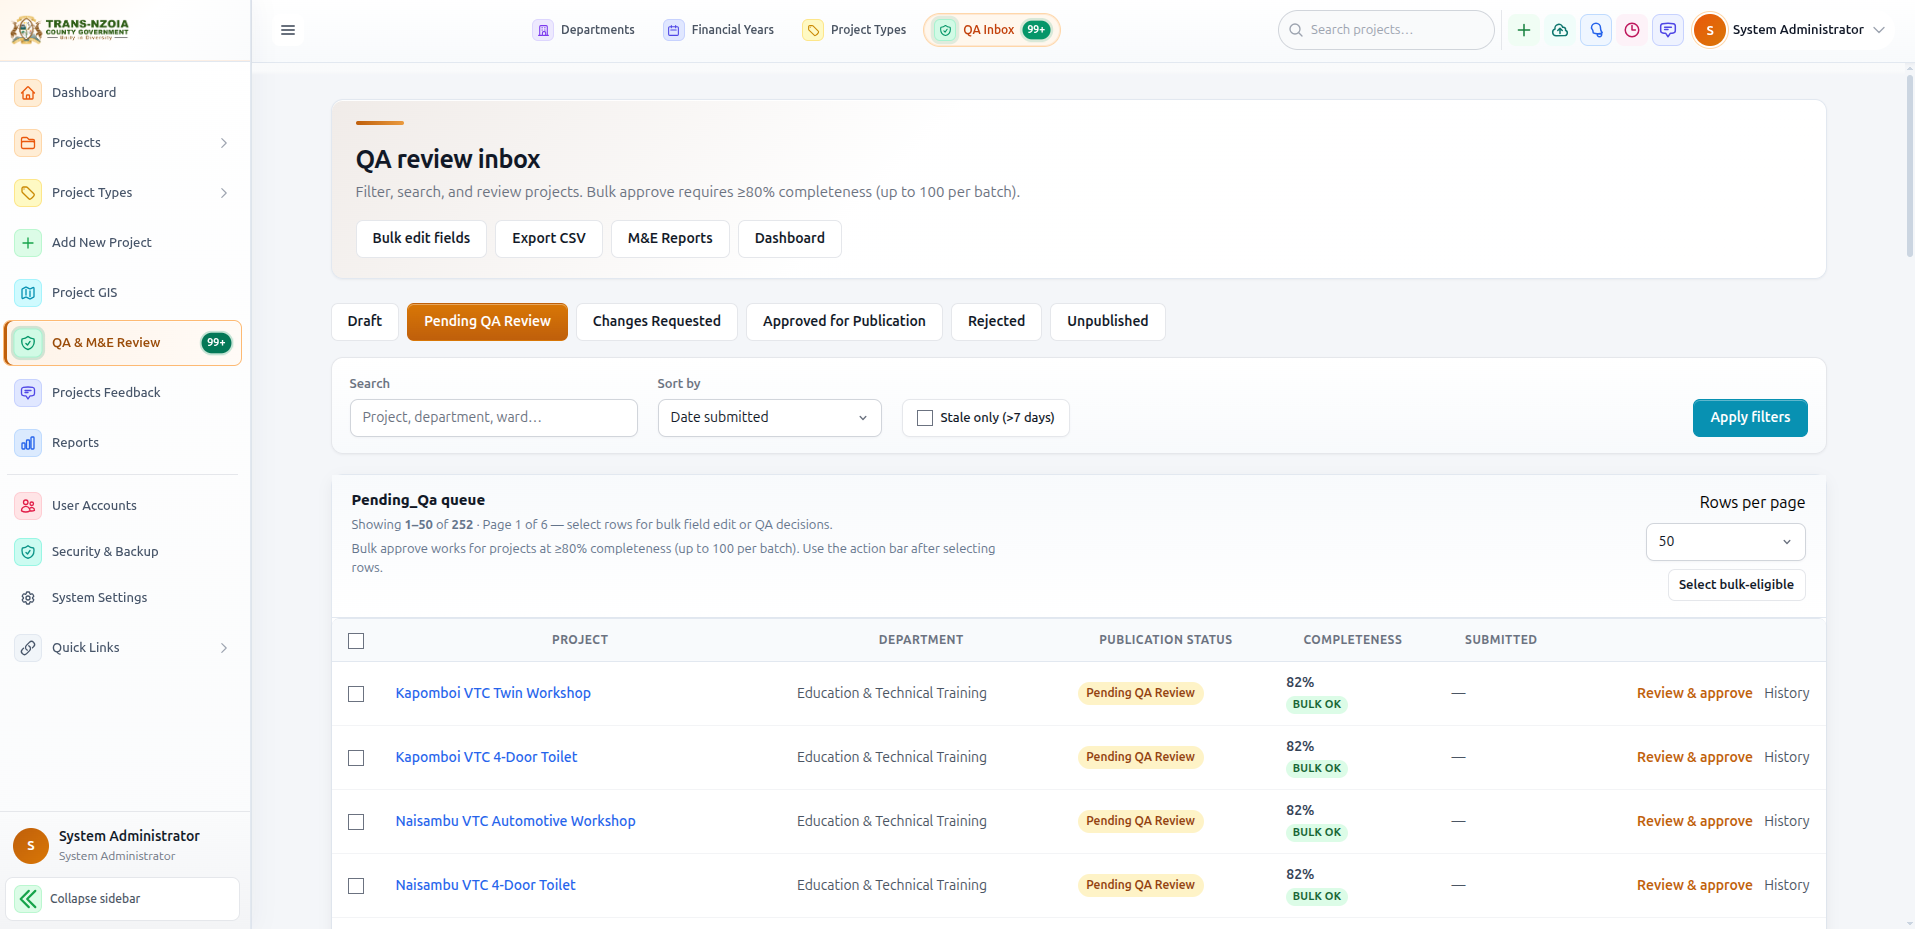
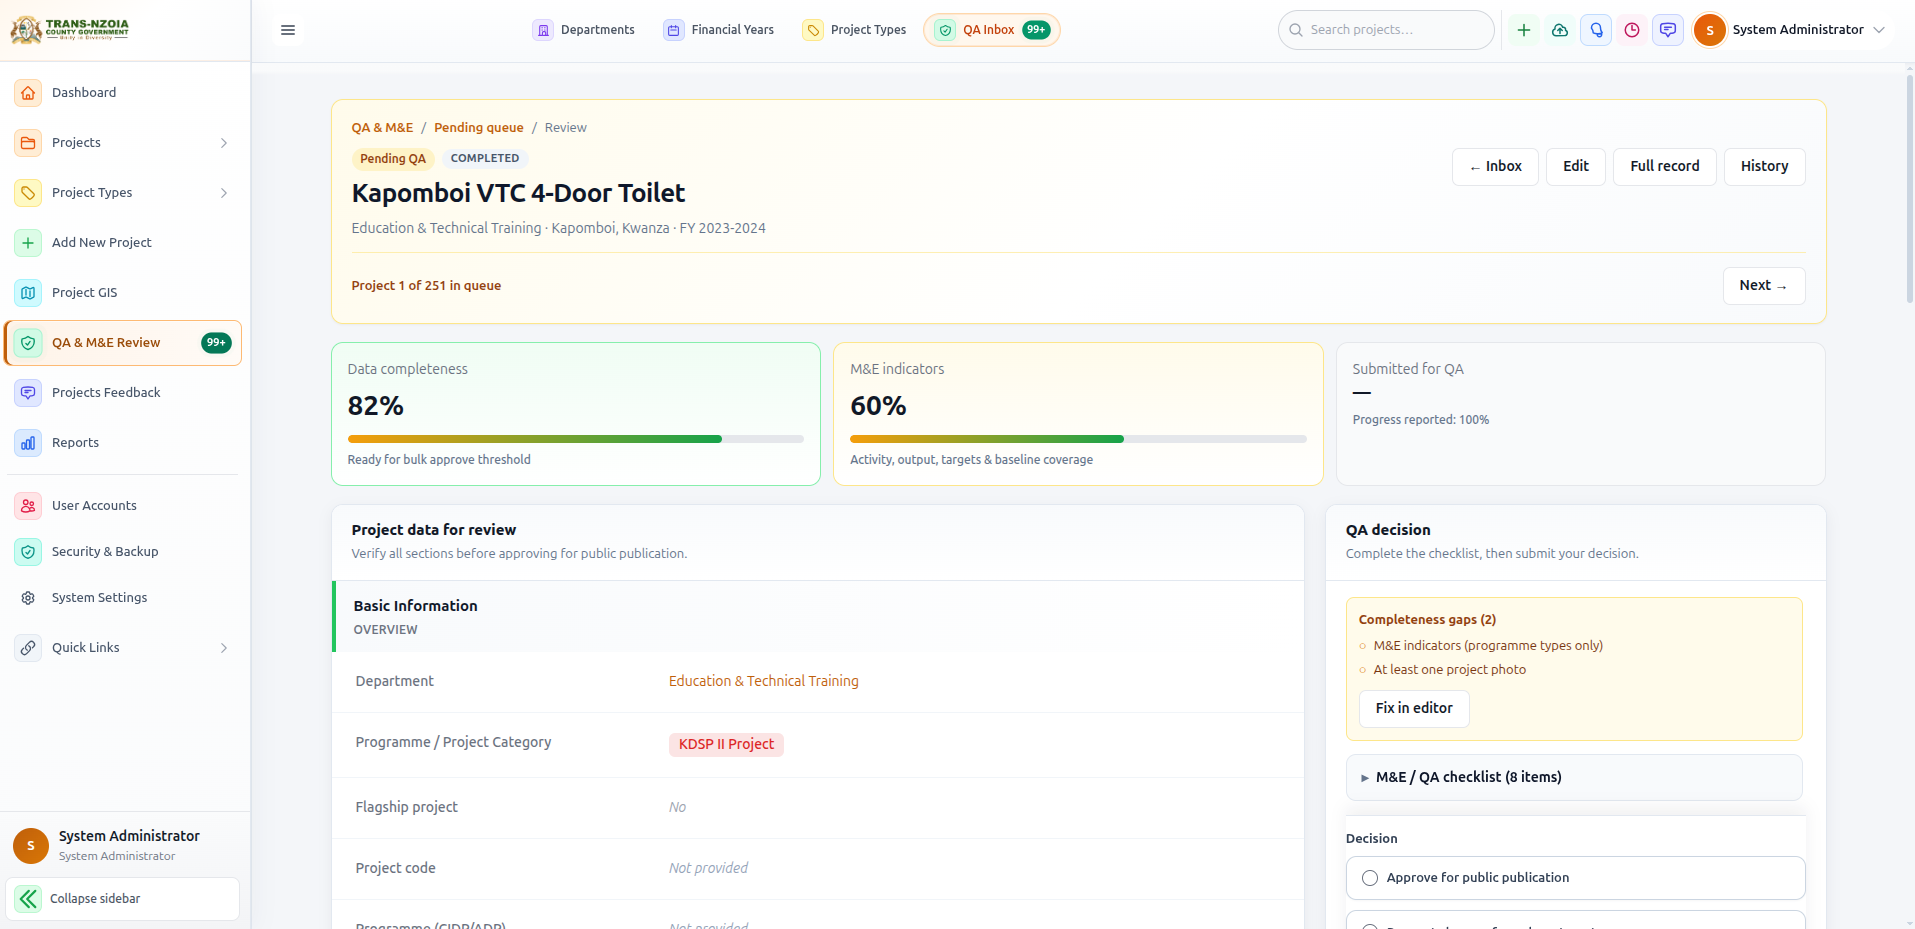
| QA & monitoring | Submit → review → approve/reject workflow through Economic Planning before public publication. |
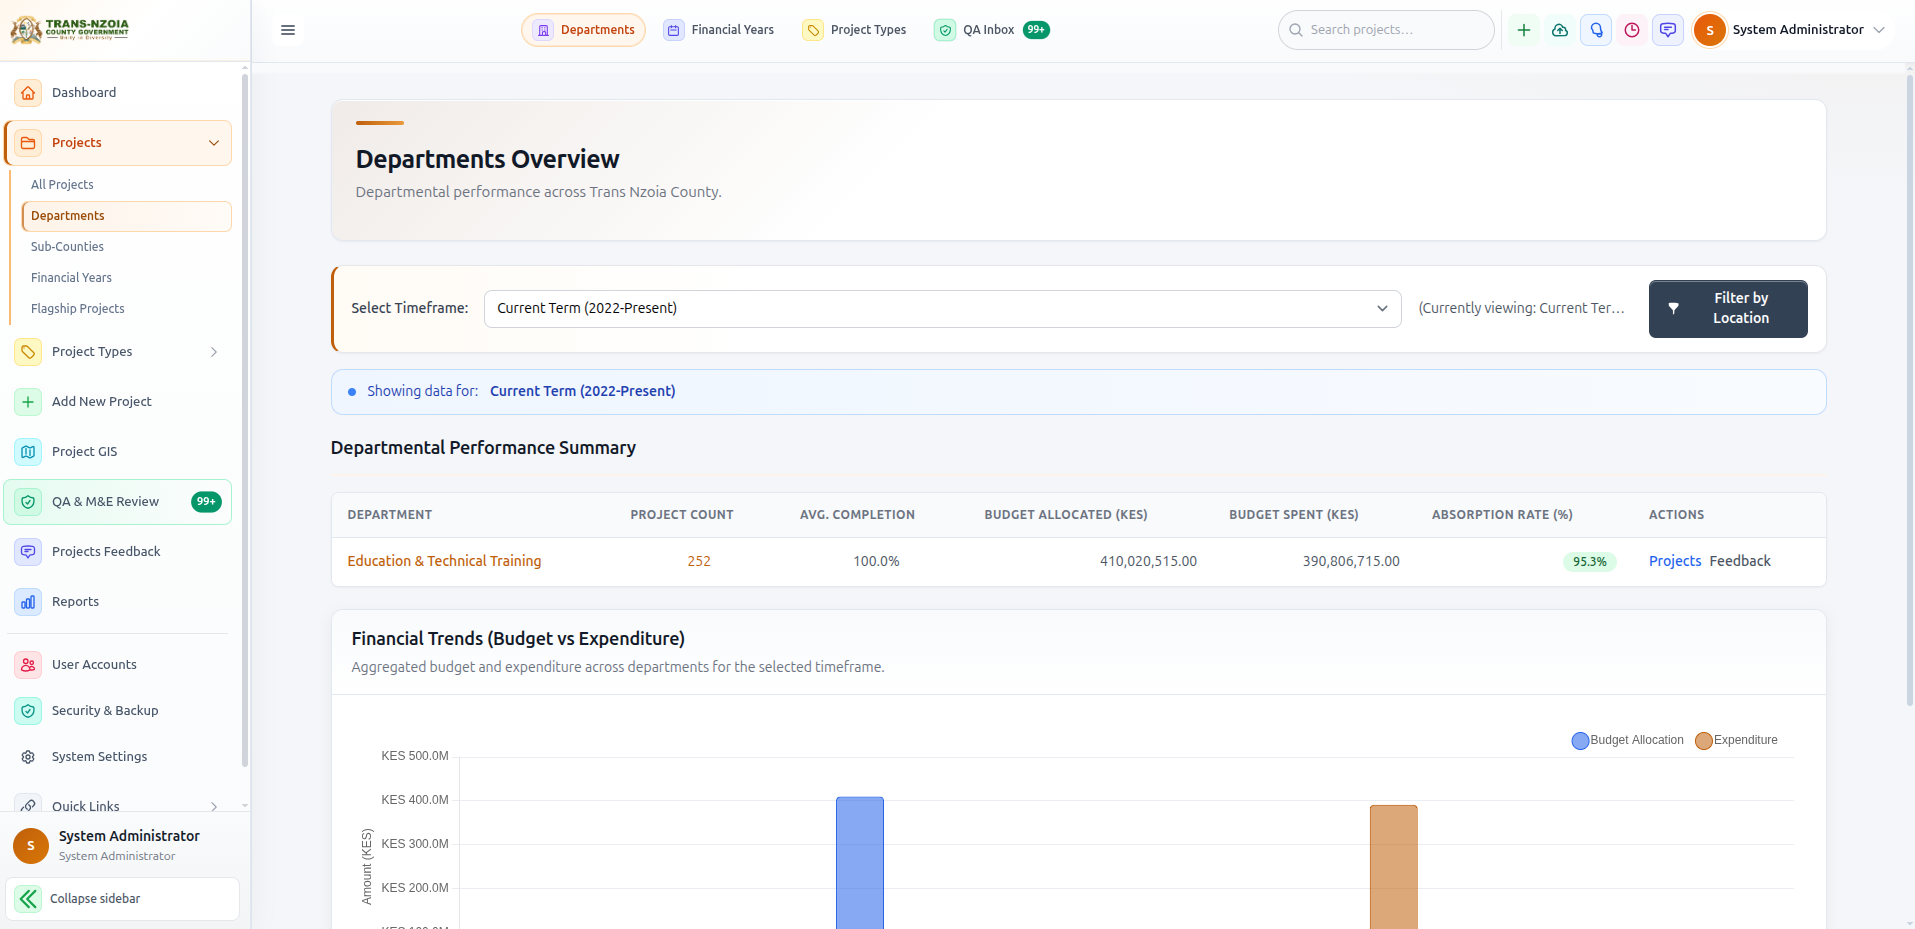
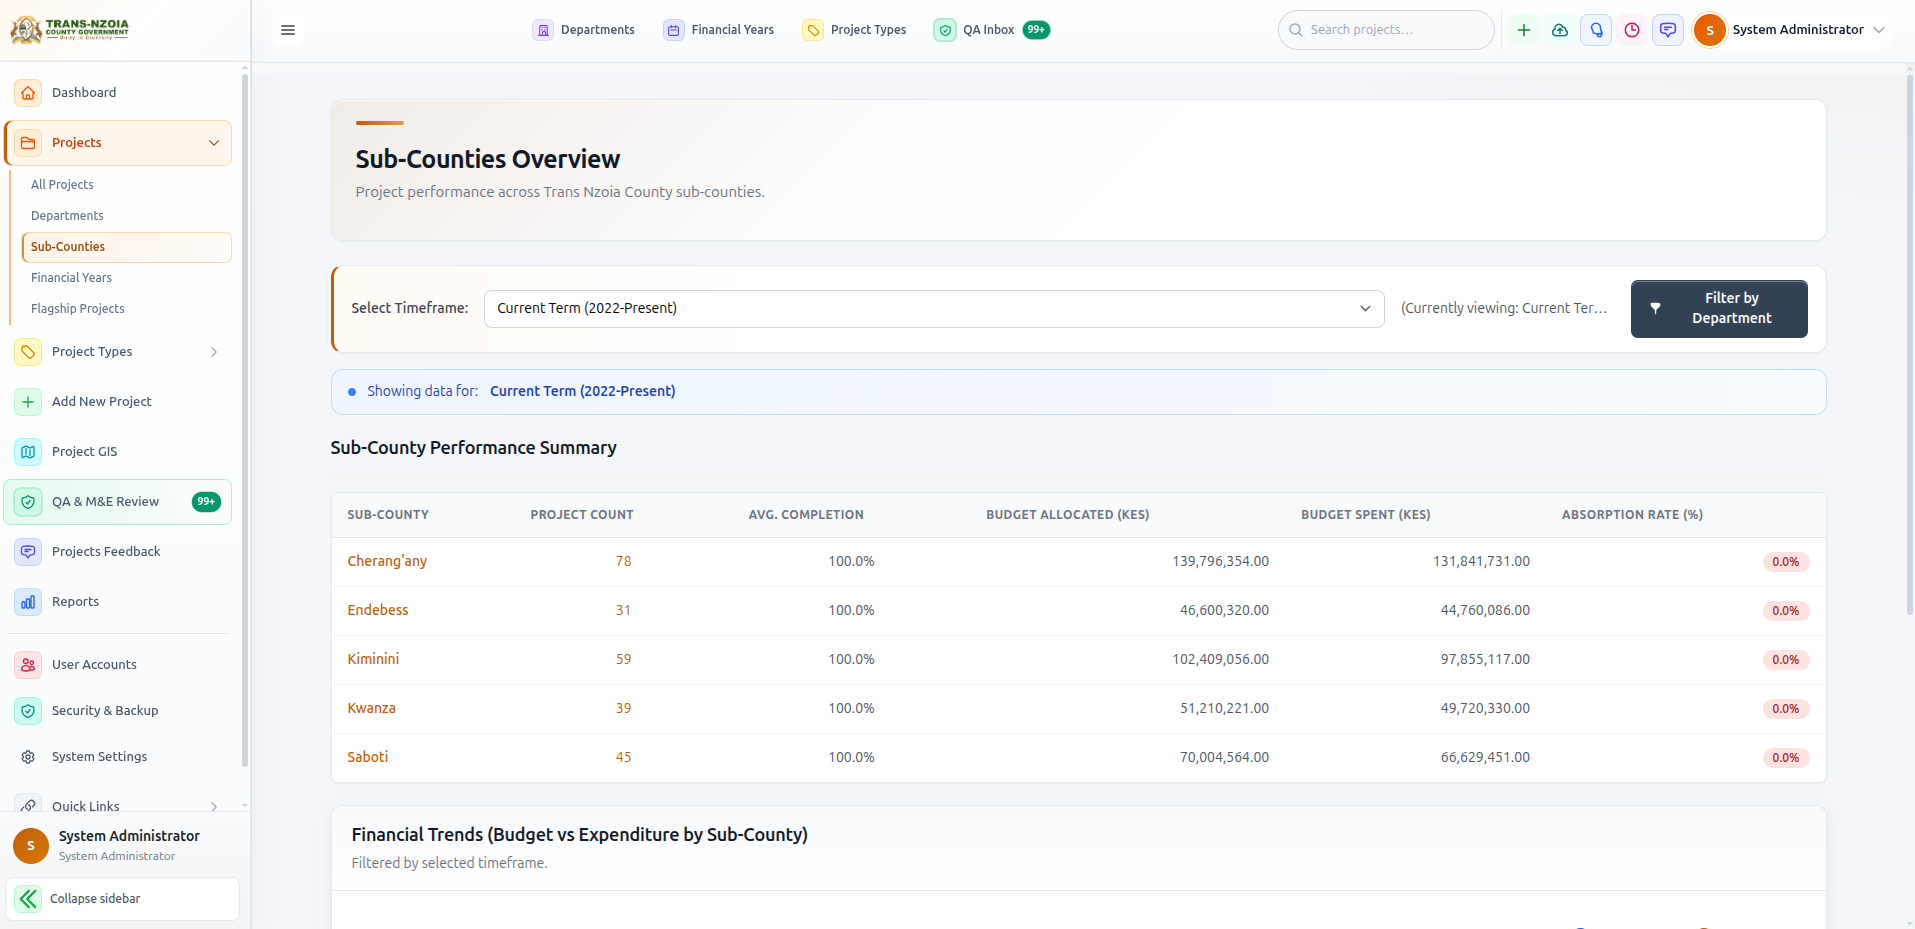
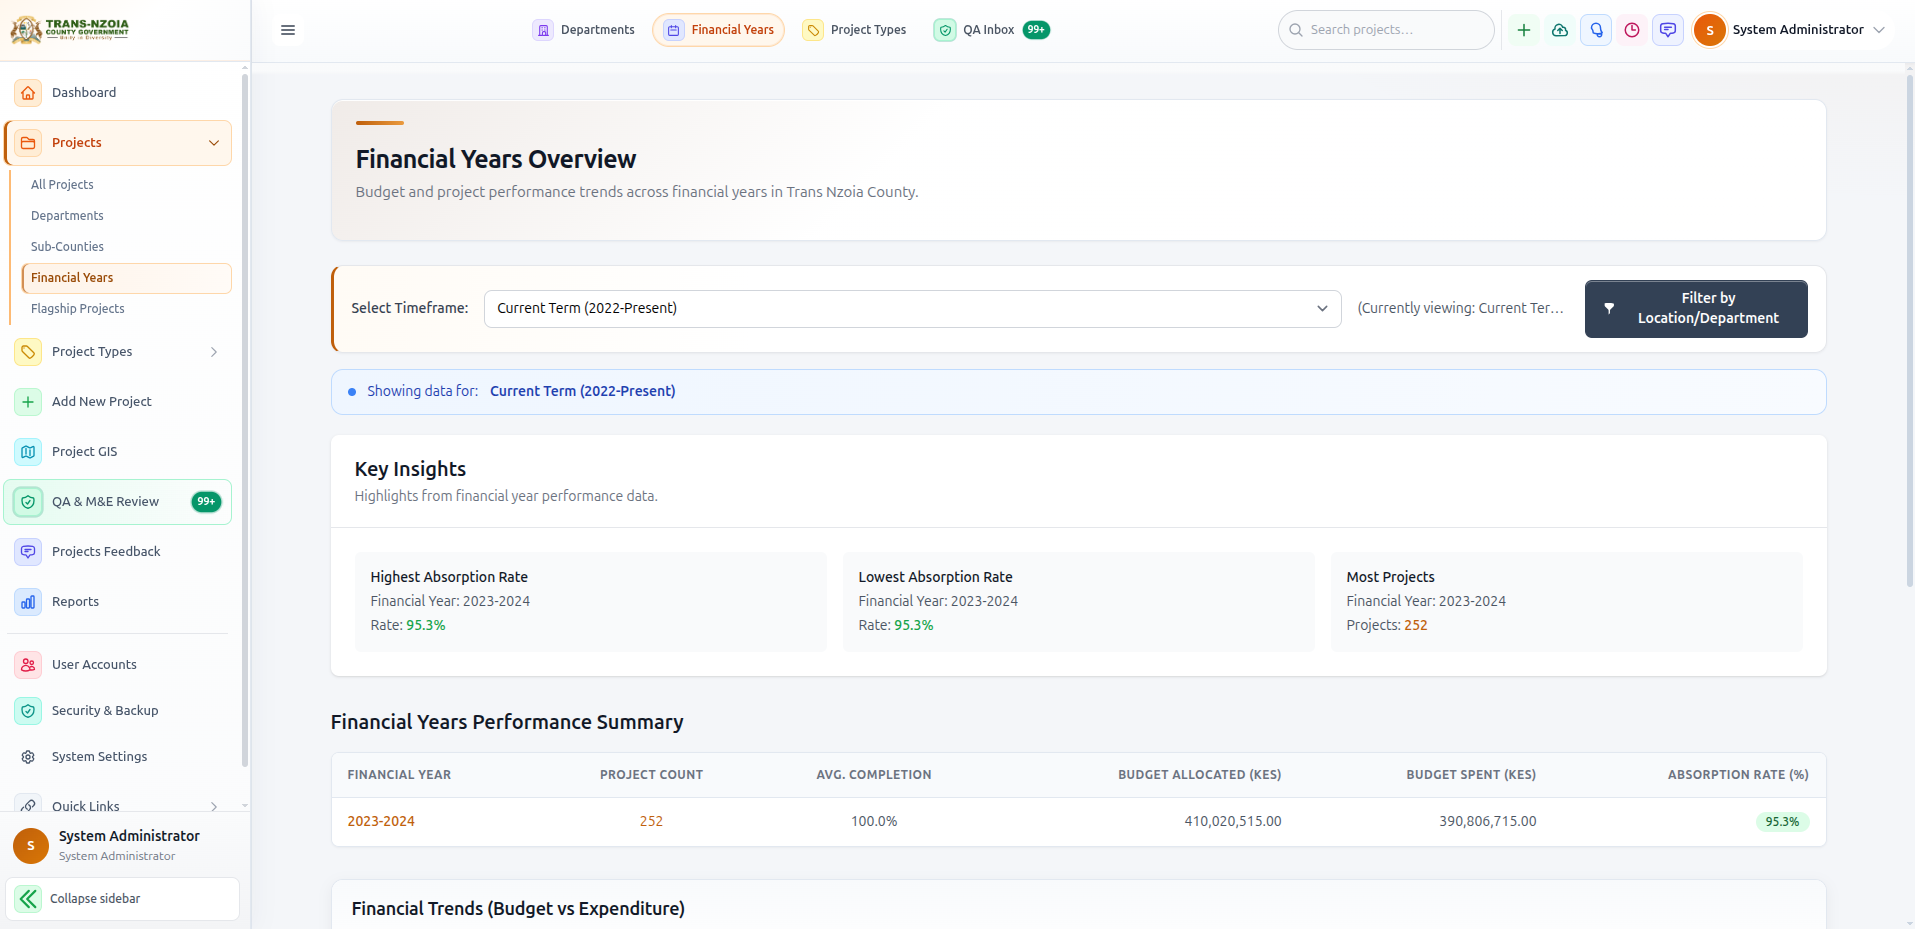
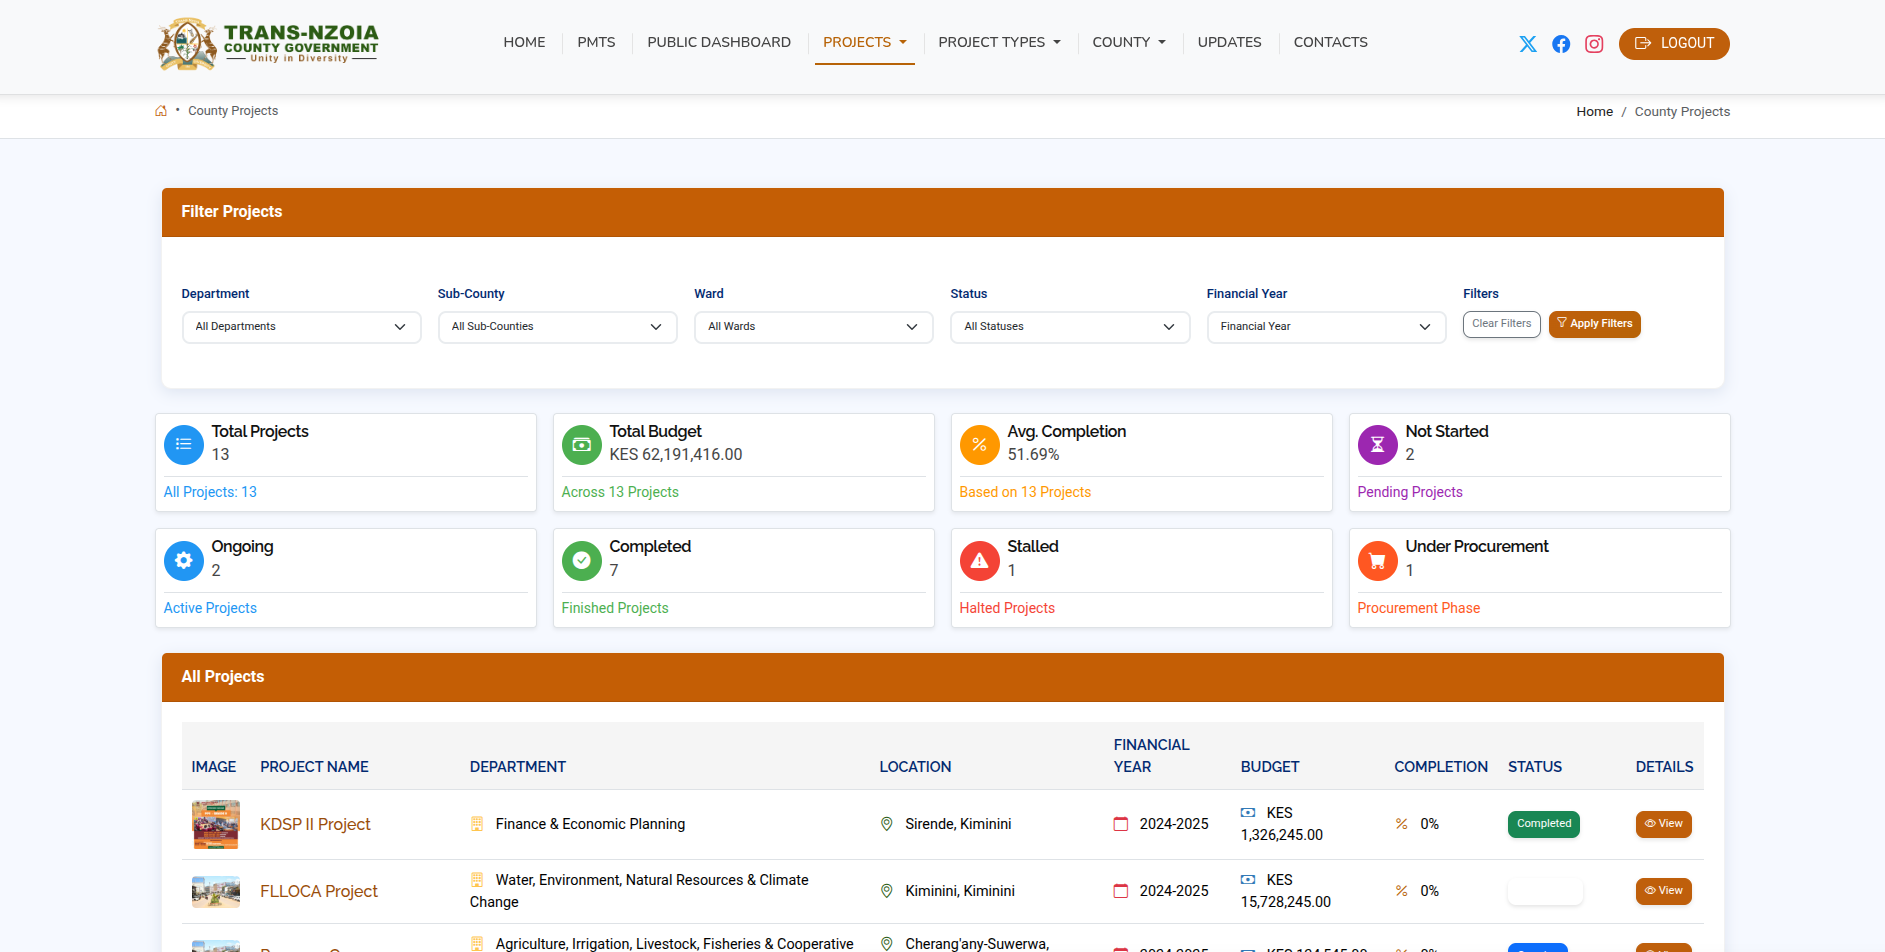
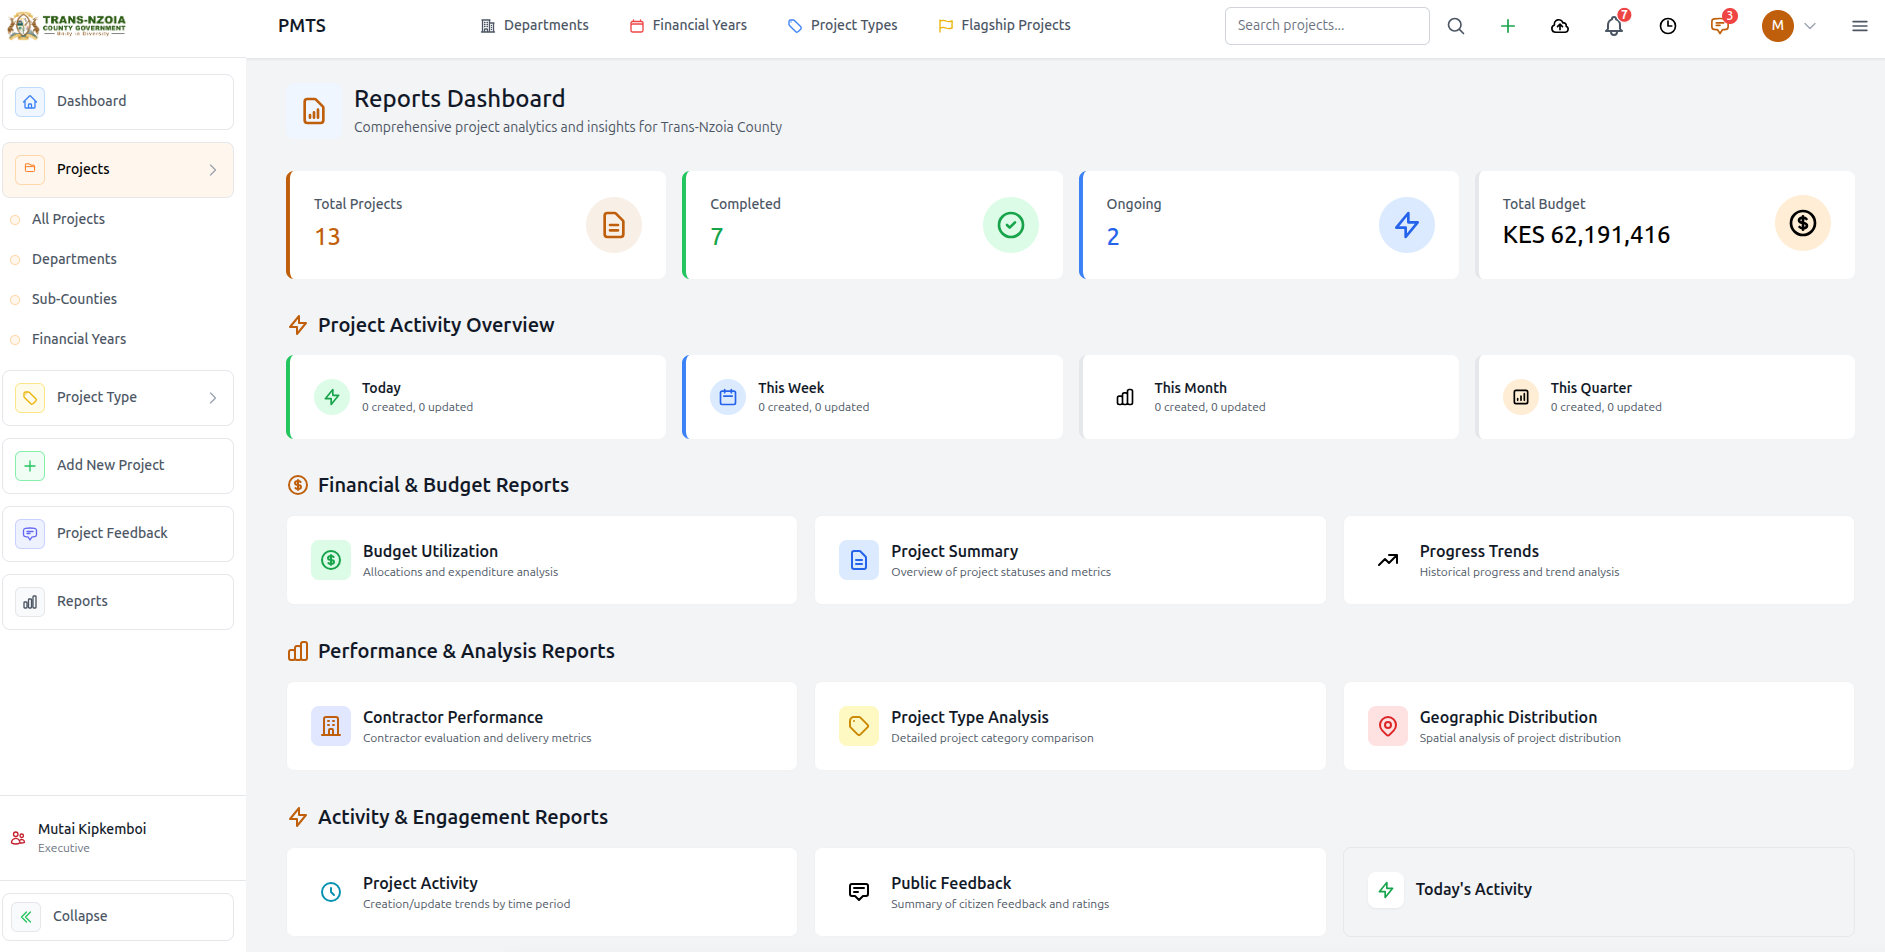
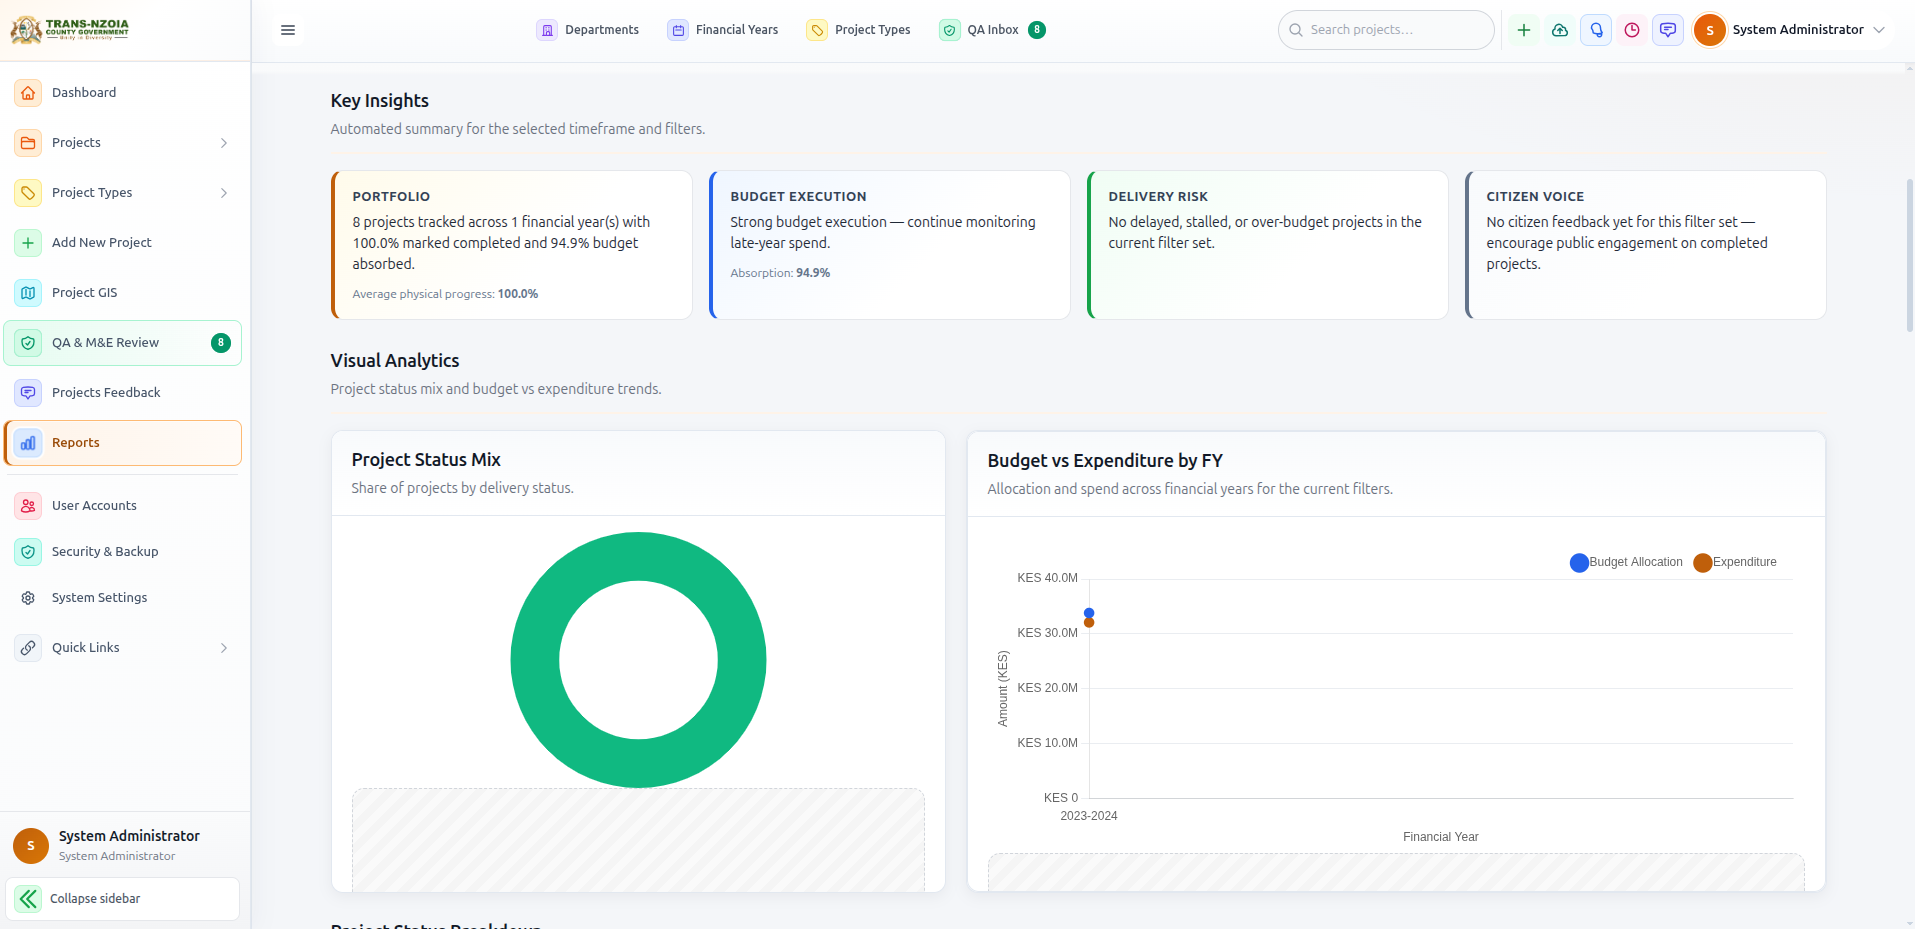
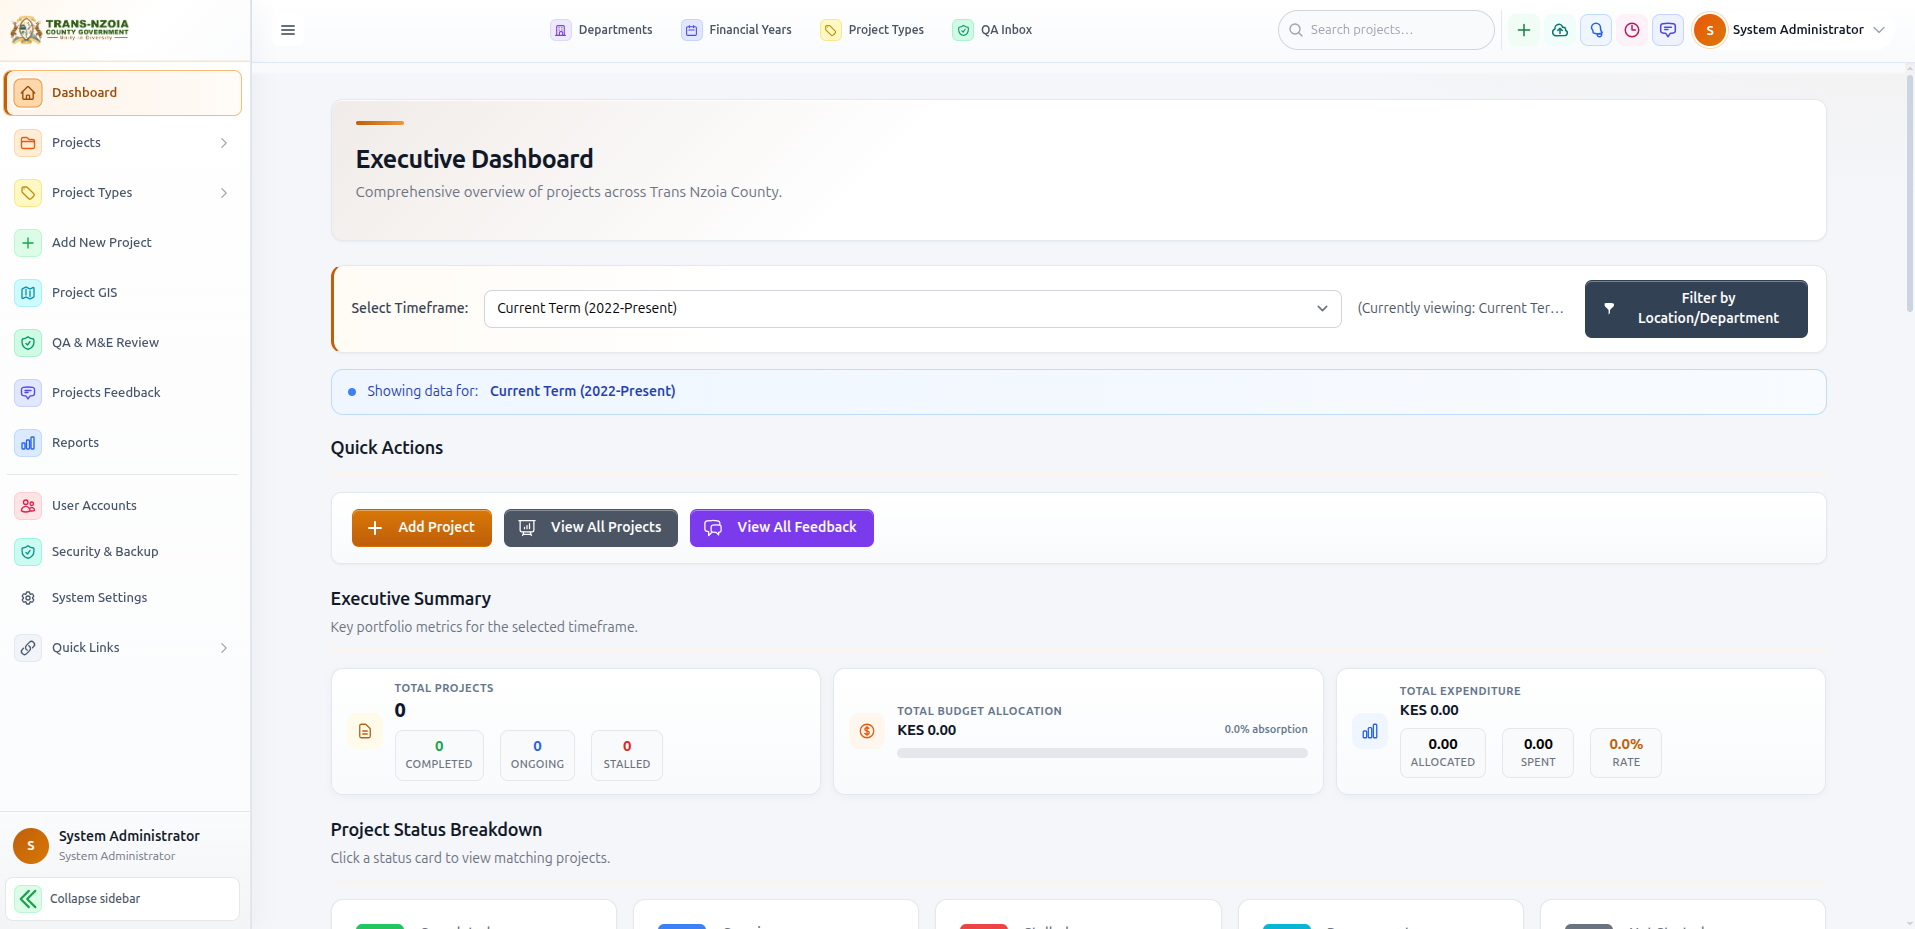
| Executive dashboards & analytics | Real-time KPI dashboards, budget utilisation, expenditure, status, and departmental performance views. |
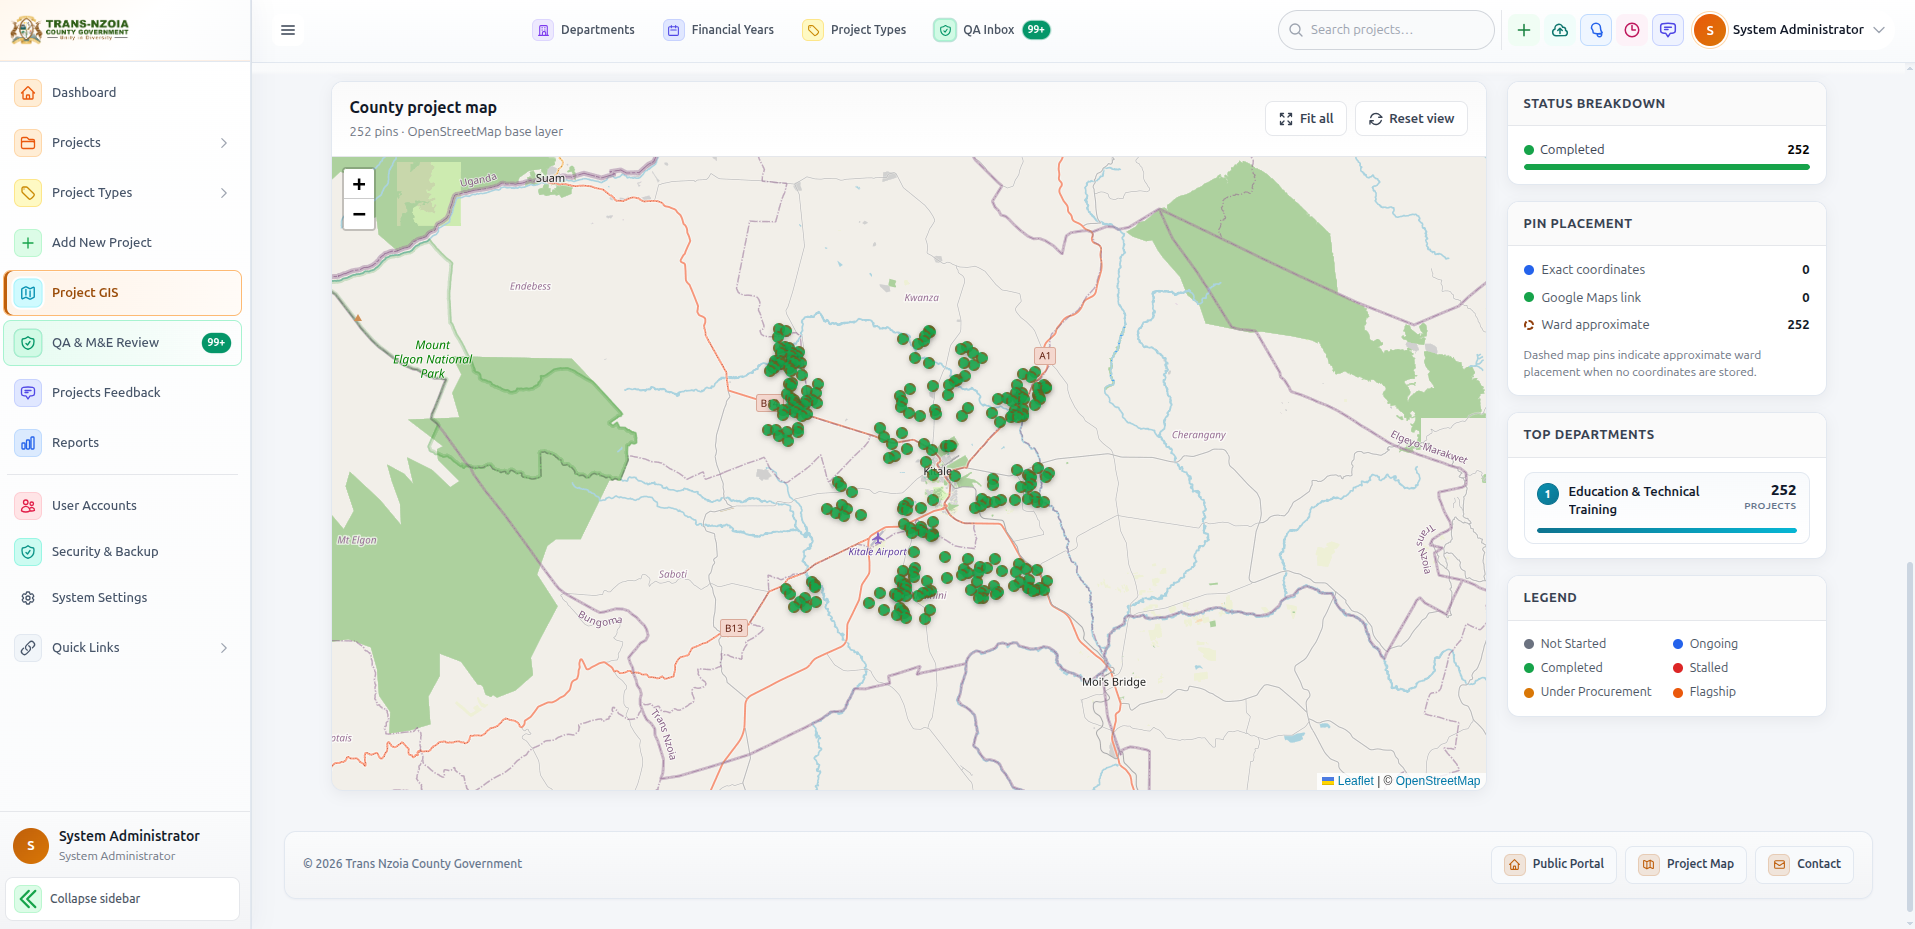
| GIS project mapping | Interactive county map with location filters and colour-coded status markers. |
| Reports & data analytics | Reports hub plus specialized exports for performance, budget, geography, and citizen engagement. |
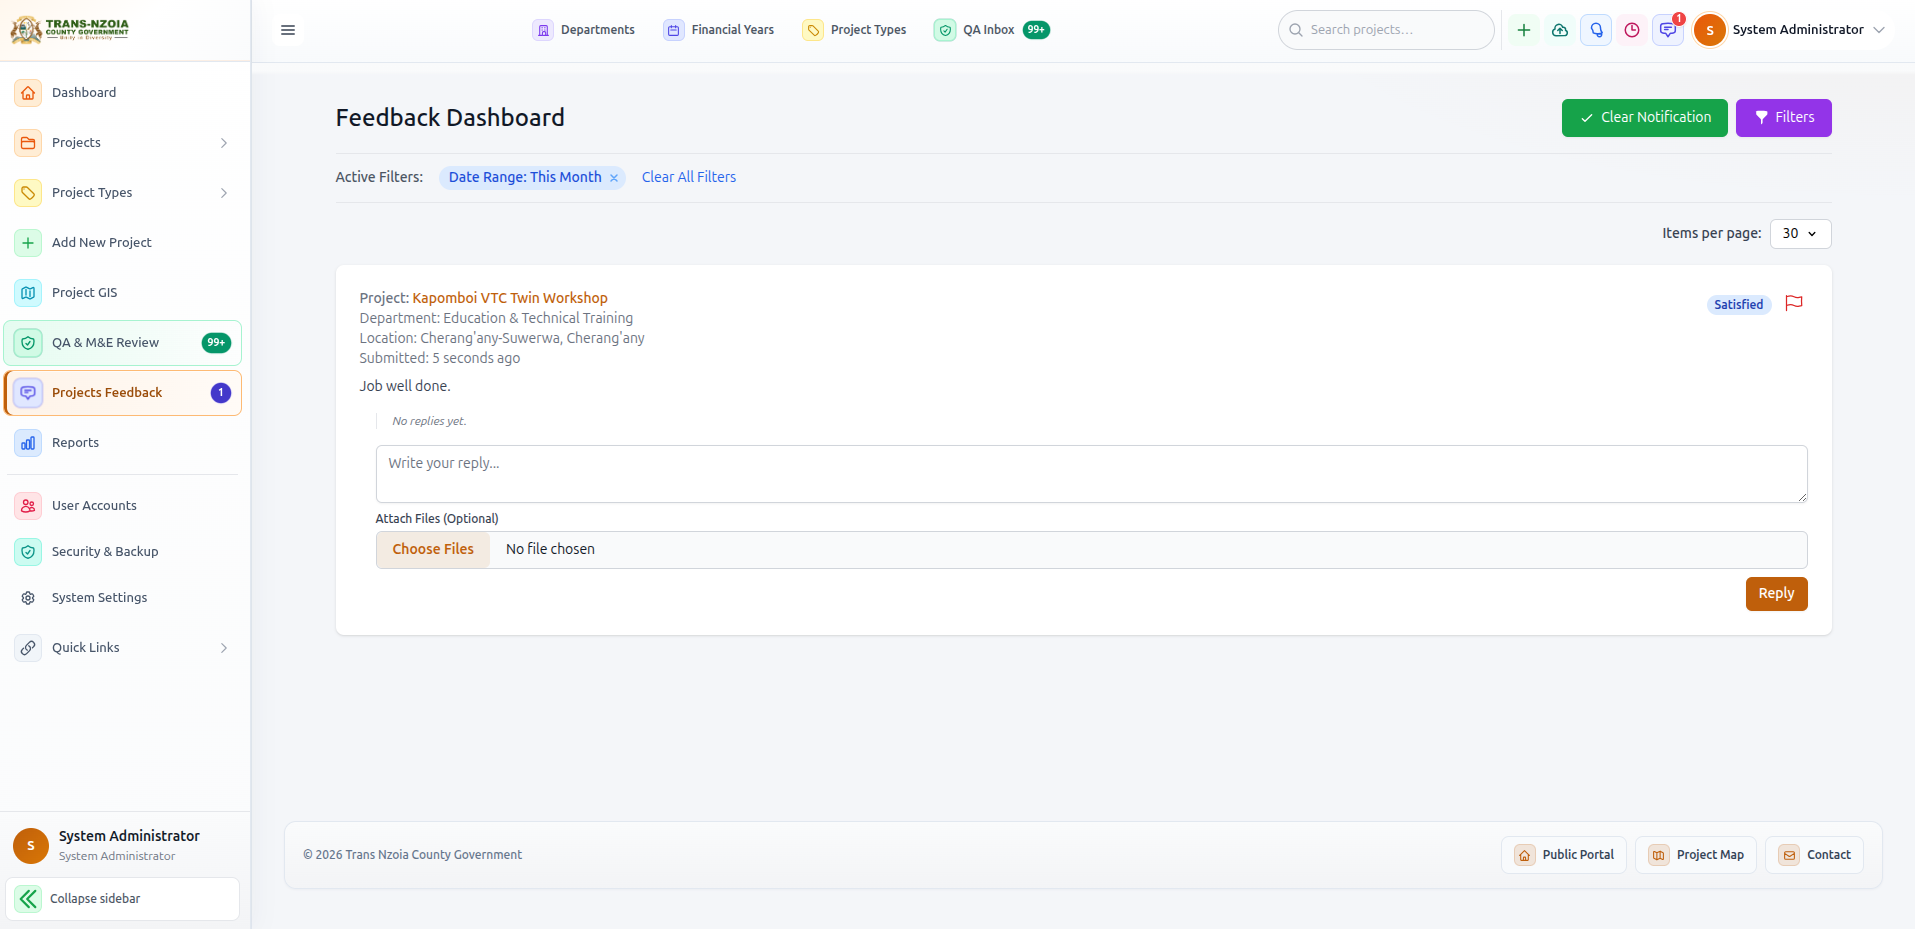
| Citizen engagement & feedback | Public portal for approved projects; citizens submit ratings and comments; staff respond from the dashboard. |
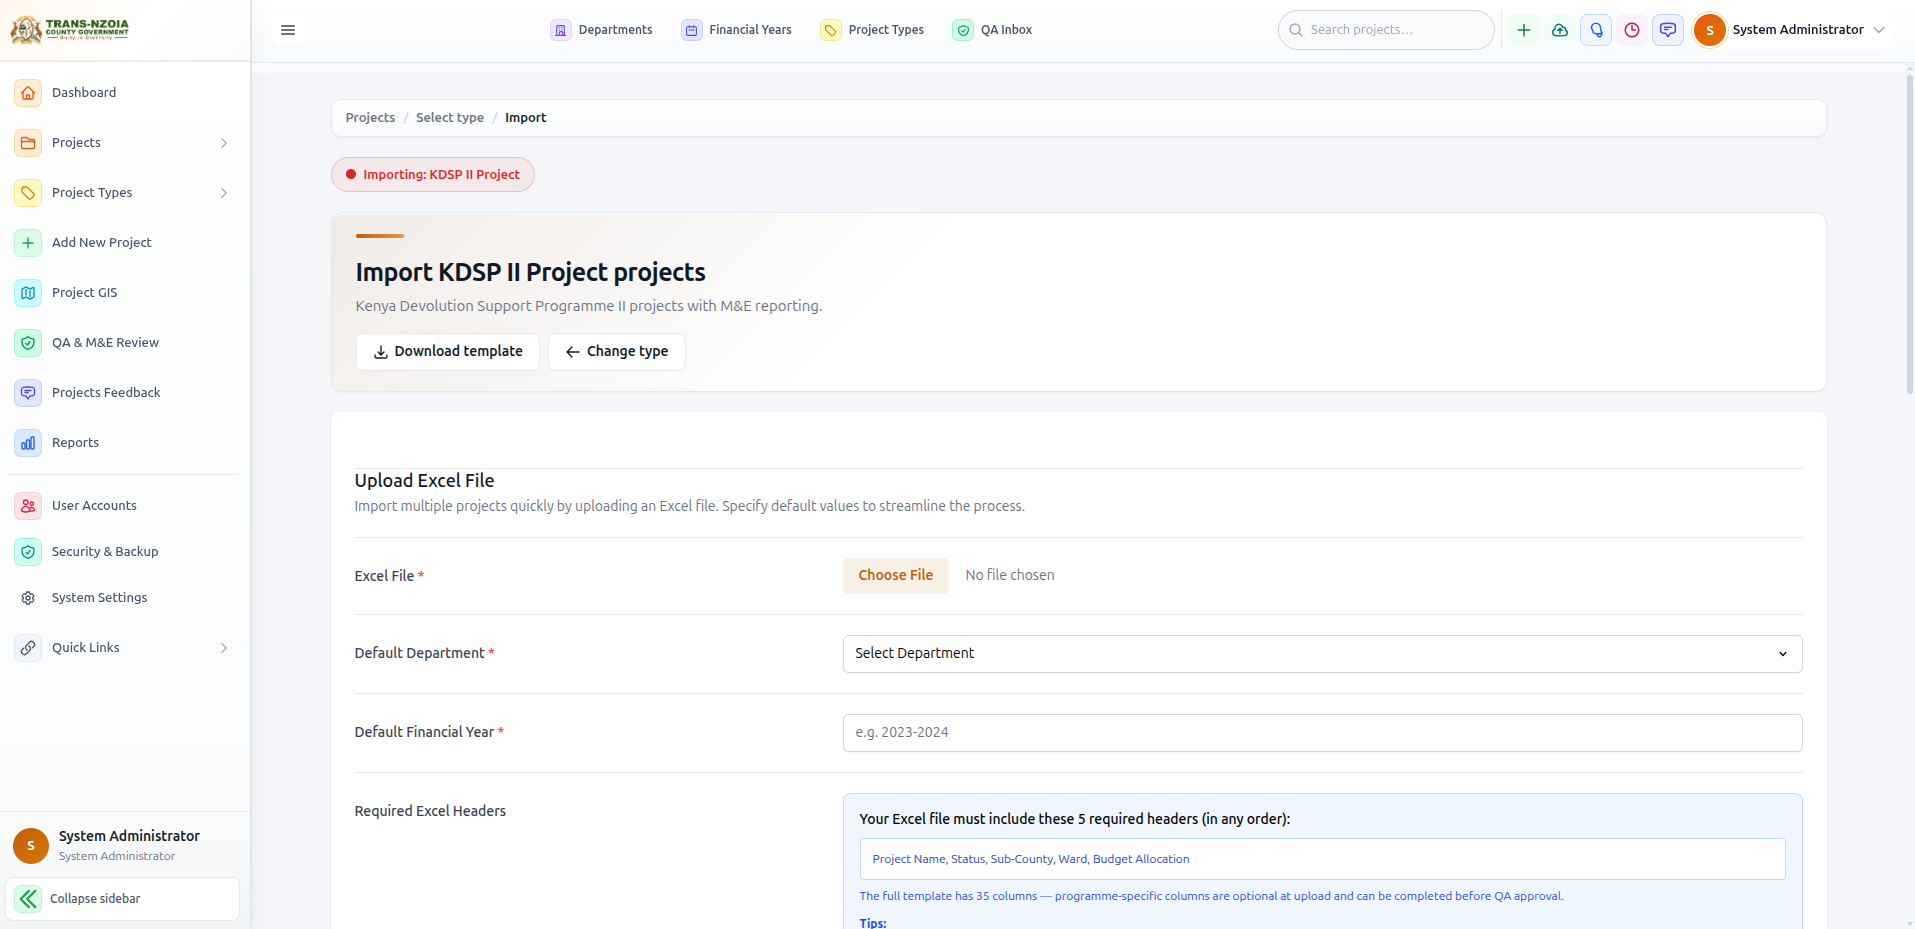
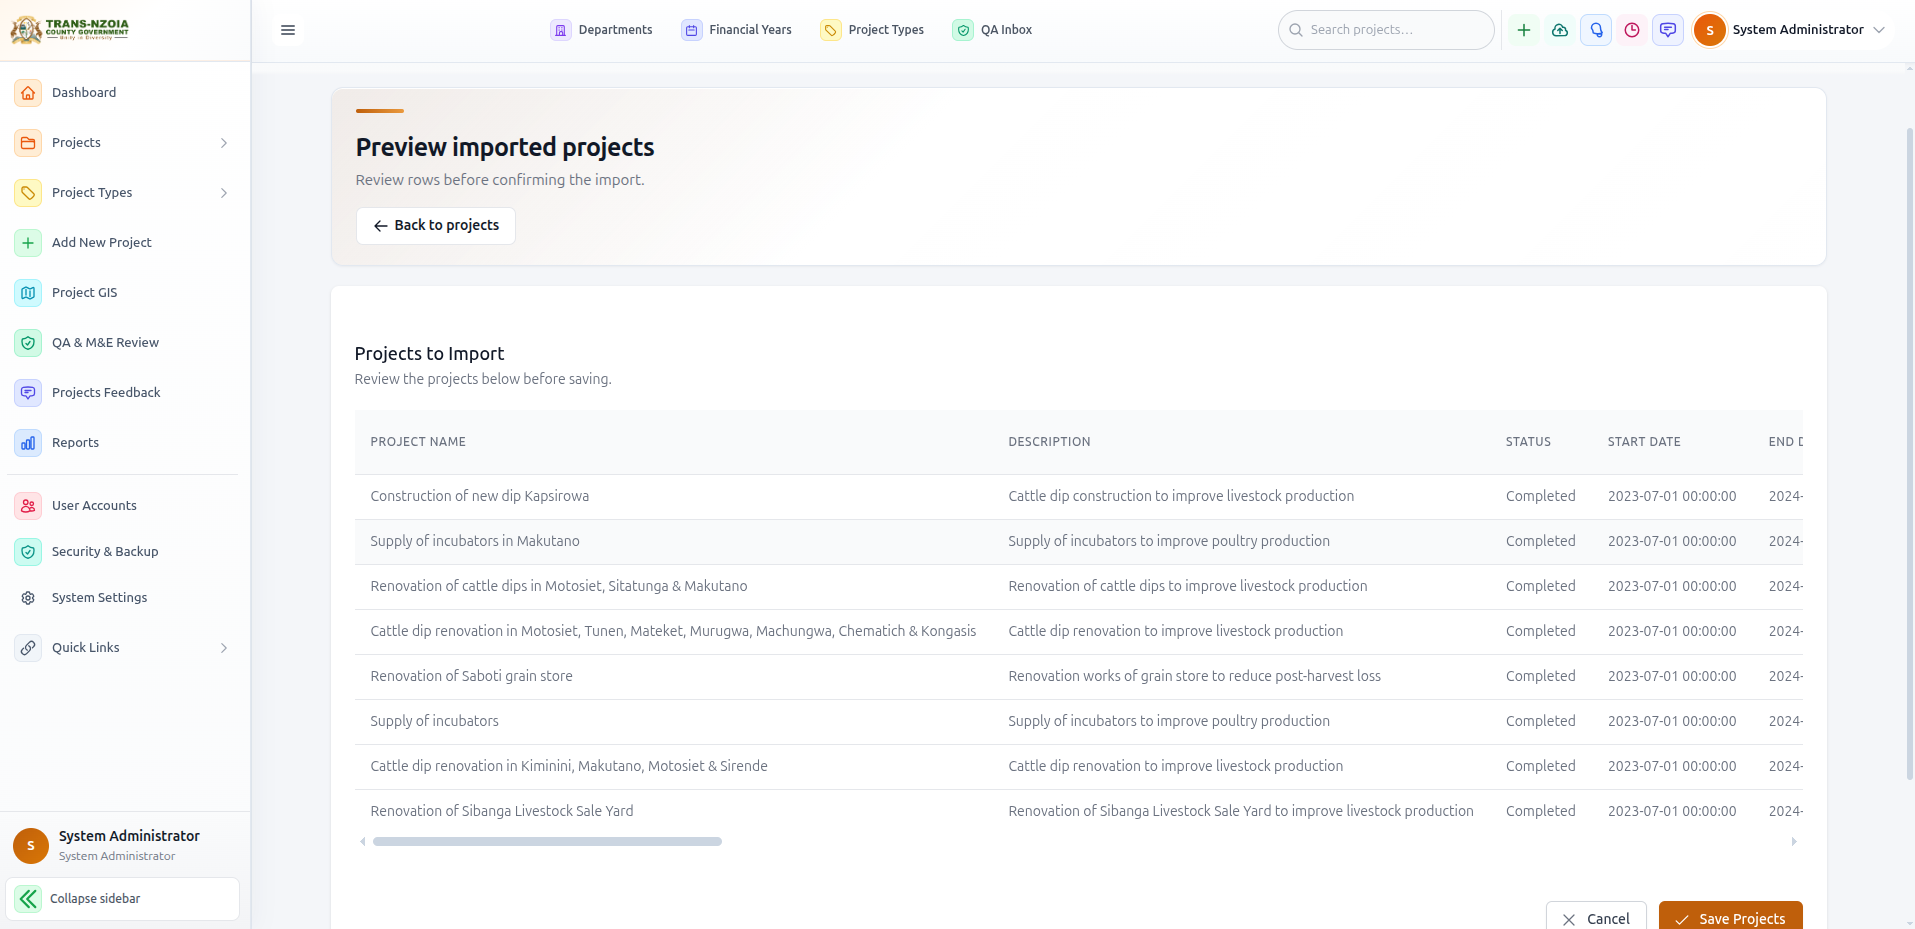
| Bulk import & management | Excel bulk import with preview/validation and spreadsheet-style bulk edit for many records at once. |
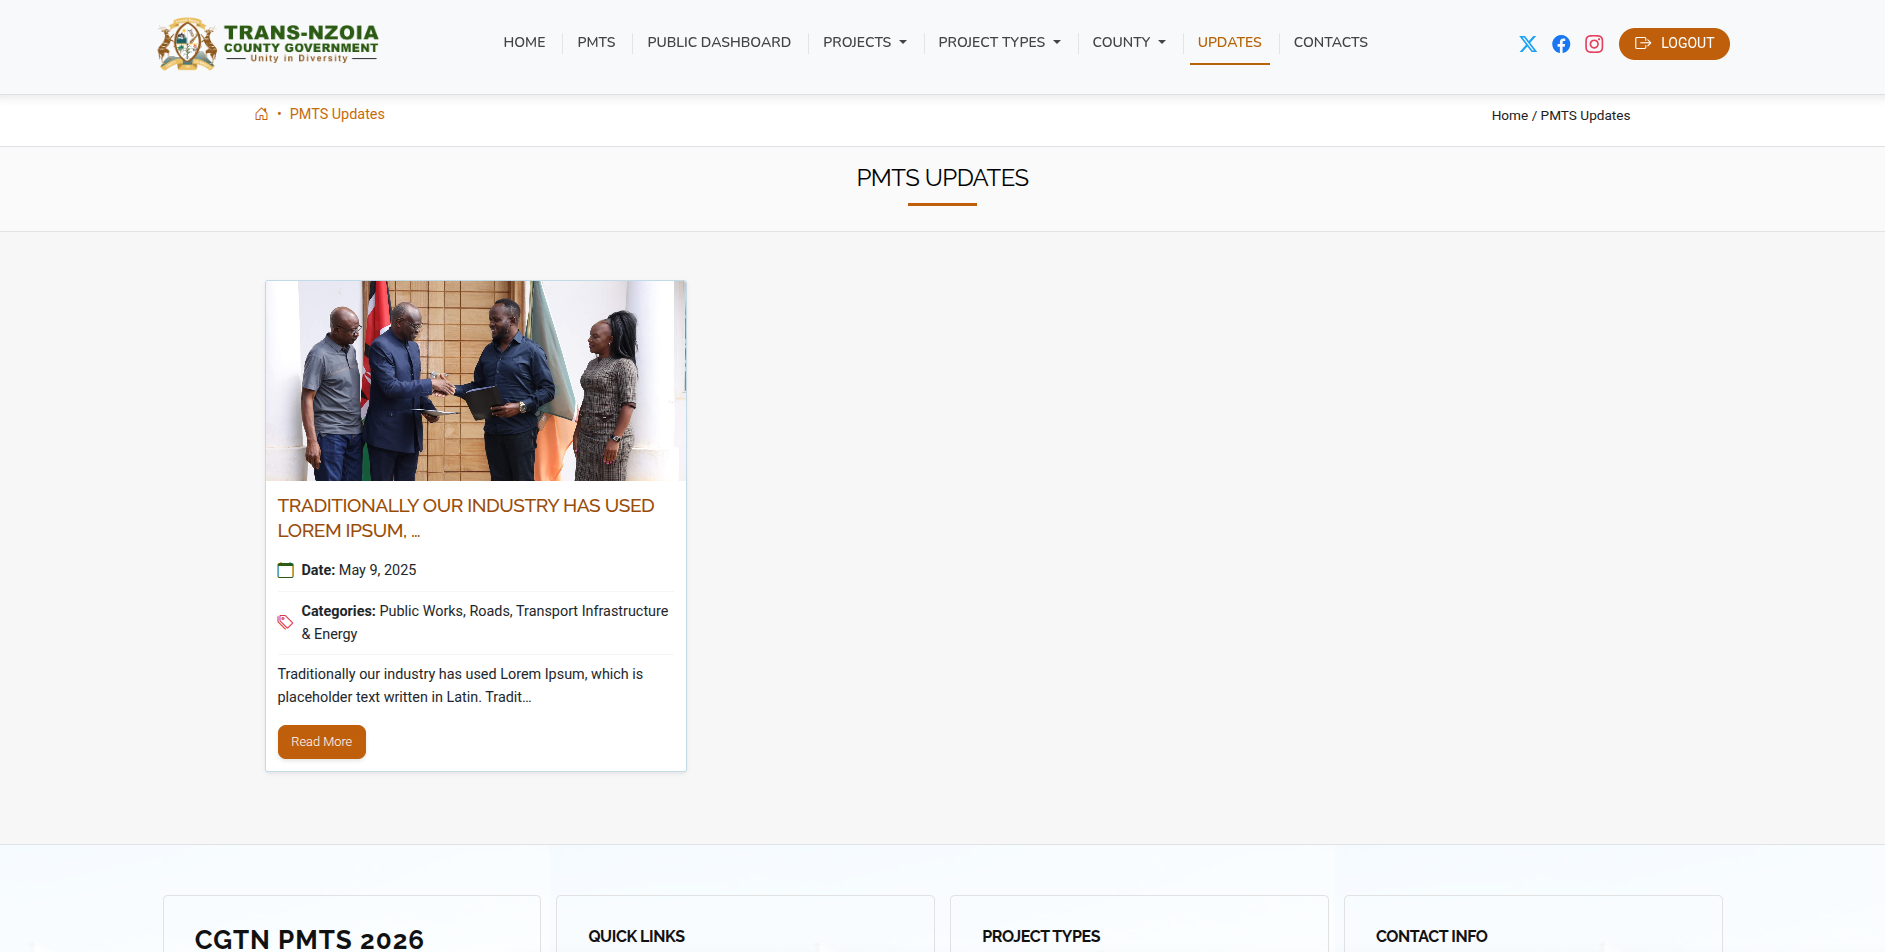
| News, resources & announcements | Staff publish downloadable resources and news posts that appear on the public Updates and Resources pages. |
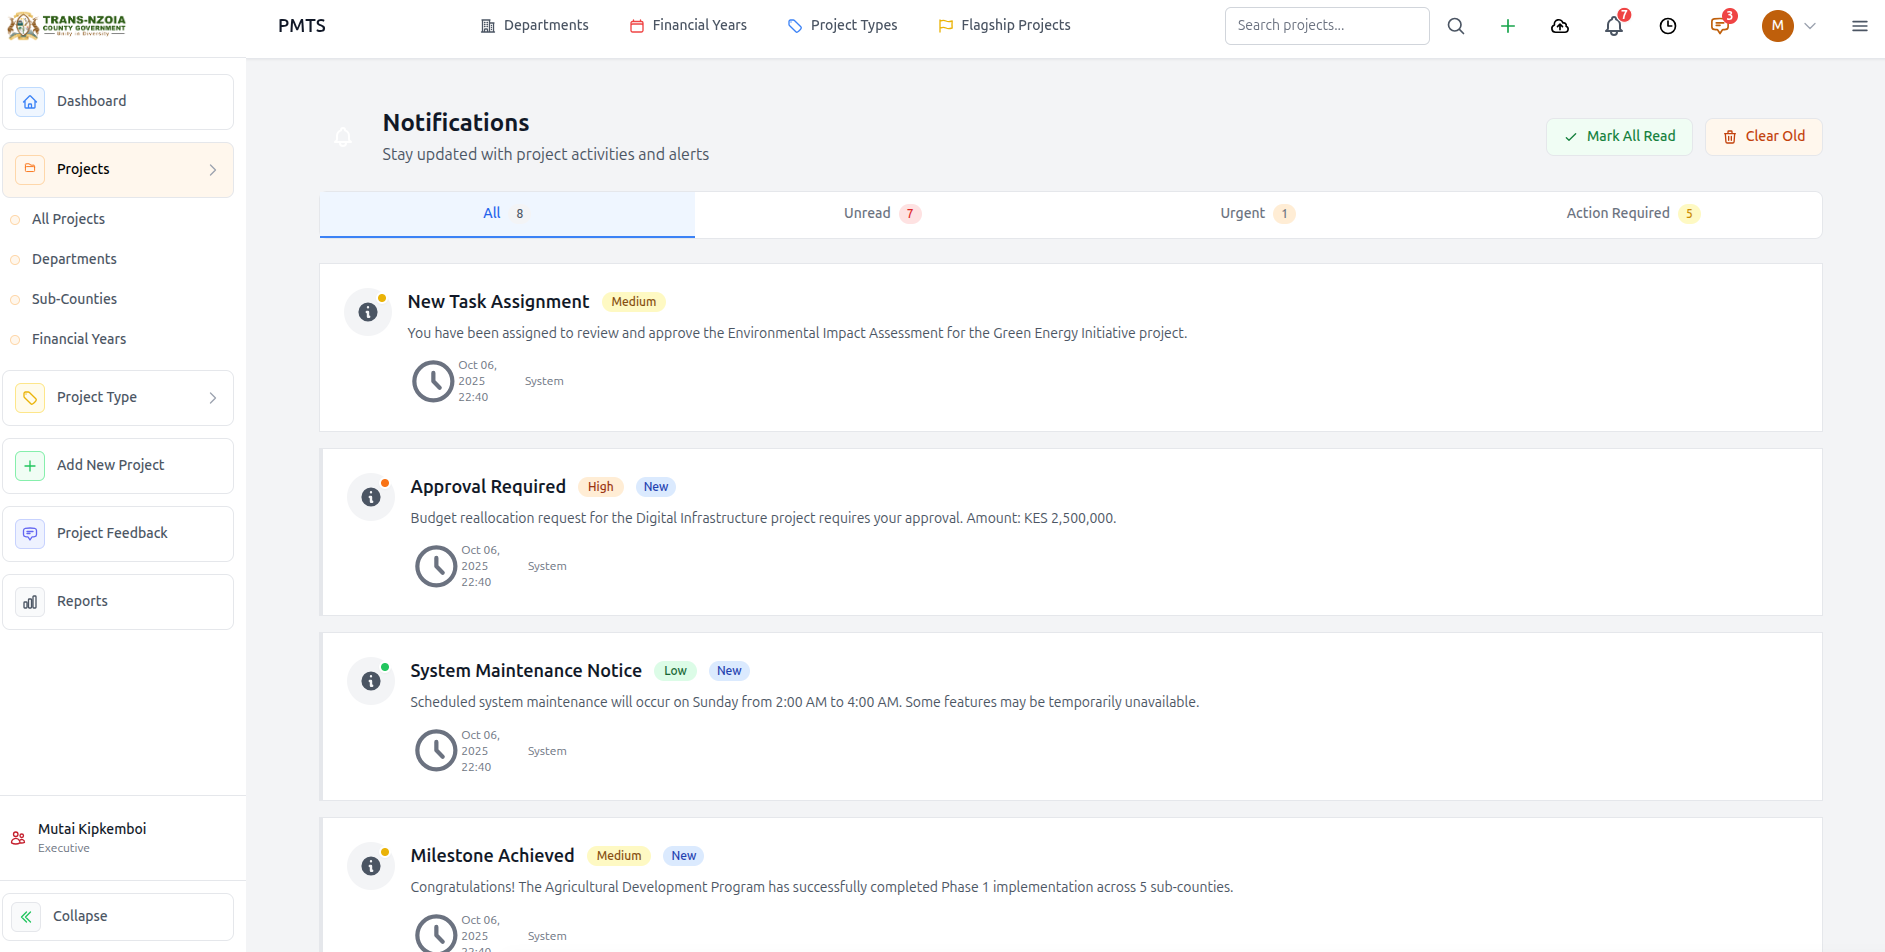
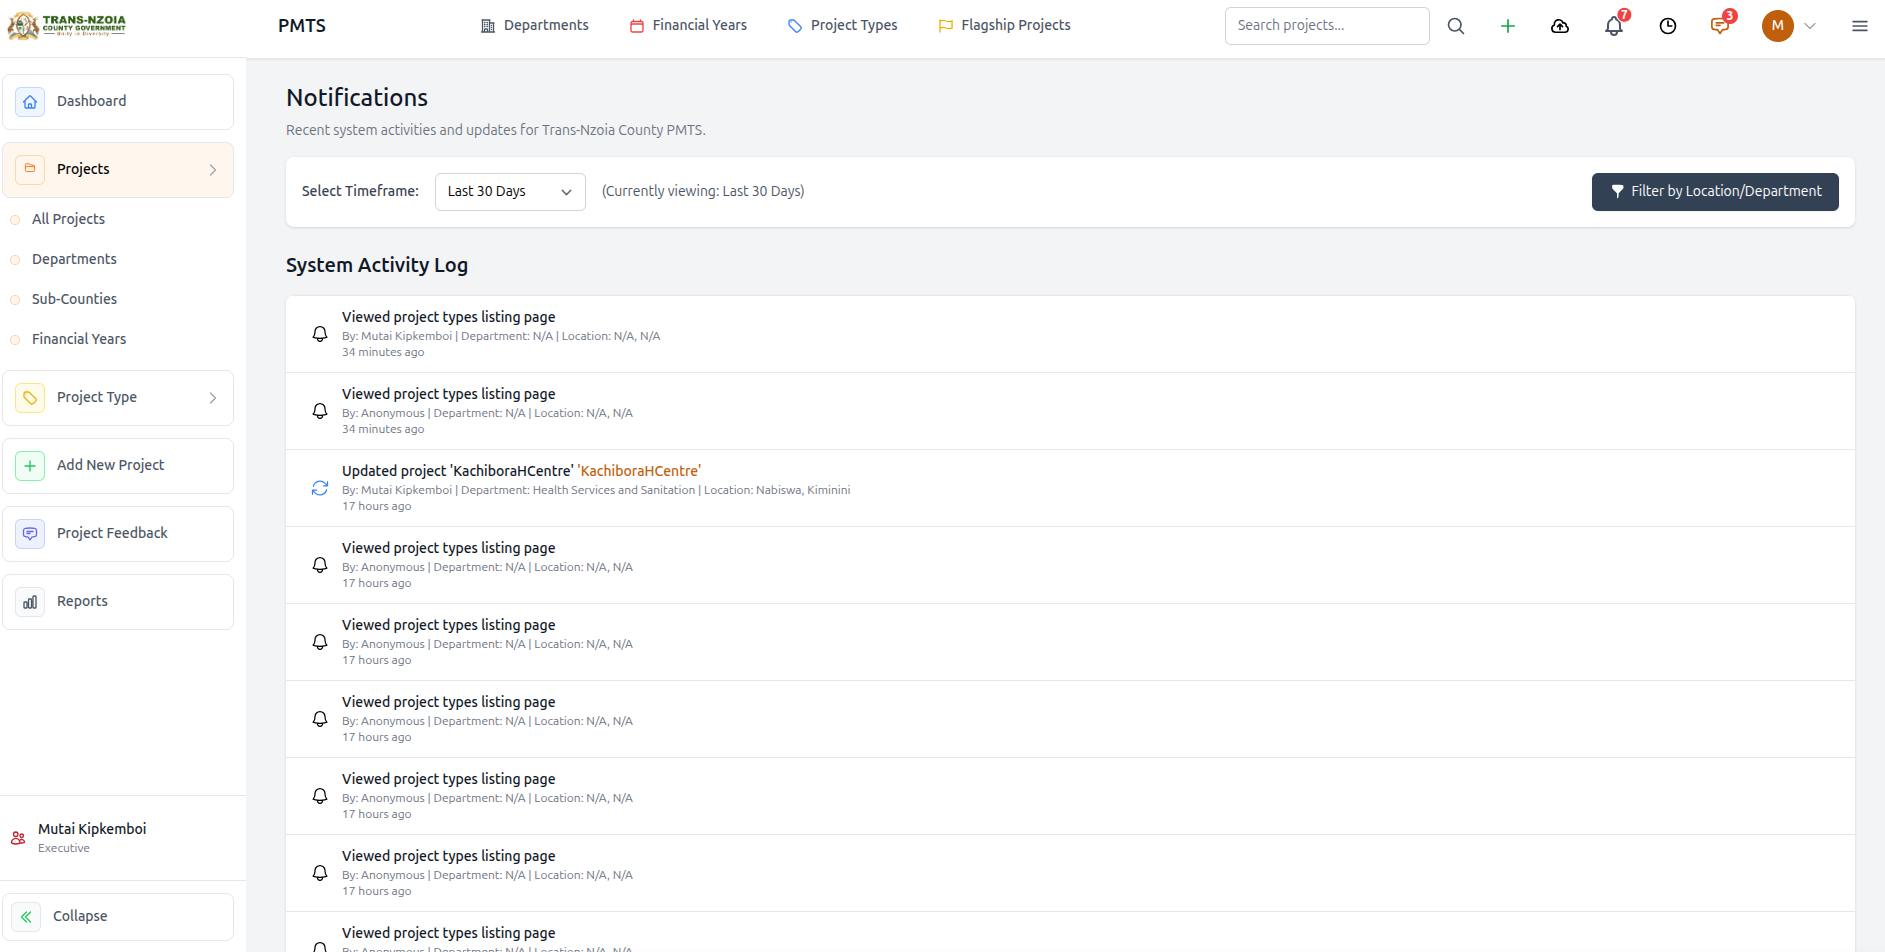
| Notifications & activity logs | Automated in-app alerts plus a searchable audit trail of user actions and system events. |
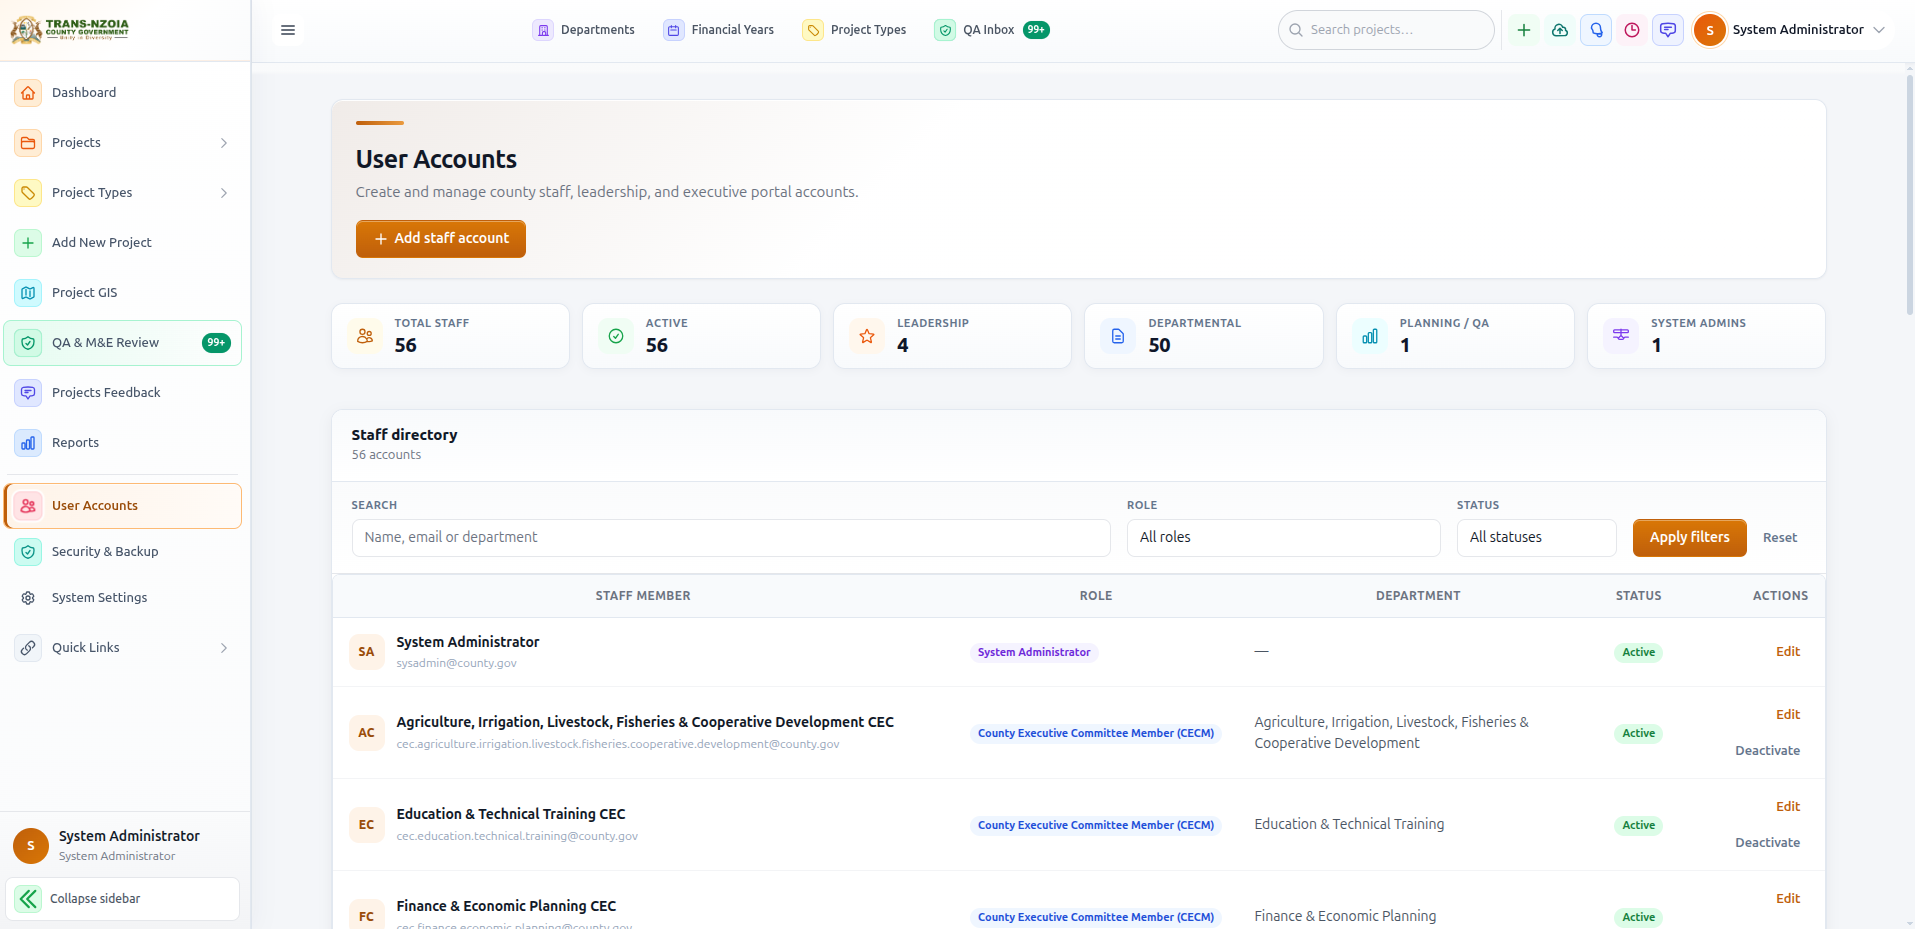
| User & security management | Role-based access, account administration, security scans, backups, and portal configuration. |
Core modules
| Module | Purpose | Primary users |
|---|---|---|
| Projects | CRUD, photos, progress, GIS map | Department staff |
| QA & M&E | Publication review gate before public visibility | Economic Planning |
| Reports | Financial, geographic, and performance analytics | County leadership & admin |
| Feedback | Citizen ratings and comments on projects | All staff |
| Resources | Downloadable policies, reports, templates | County leadership & admin |
| Updates | County news and project announcements | County leadership & admin |
| User accounts | Staff onboarding, roles, security & backup | System administrators |